Please help step by step for R program with a final code for understanding thank you.
MATLAB: An Introduction with Applications
6th Edition
ISBN:9781119256830
Author:Amos Gilat
Publisher:Amos Gilat
Chapter1: Starting With Matlab
Section: Chapter Questions
Problem 1P
Related questions
Question
Please help step by step for R program with a final code for understanding thank you.

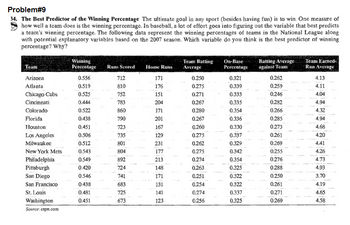
Transcribed Image Text:Problem#9
34. The Best Predictor of the Winning Percentage The ultimate goal in any sport (besides having fun) is to win. One measure of
how well a team does is the winning percentage. In baseball, a lot of effort goes into figuring out the variable that best predicts
a team's winning percentage. The following data represent the winning percentages of teams in the National League along
with potential explanatory variables based on the 2007 season. Which variable do you think is the best predictor of winning
percentage? Why?
Team
Arizona
Atlanta
Chicago Cubs
Cincinnati
Colorado
Florida
Houston
Los Angeles
Milwaukee
New York Mets
Philadelphia
Pittsburgh
San Diego
San Francisco
St. Louis
Washington
Source: espn.com
Winning
Percentage Runs Scored Home Runs
0.556
0.519
0.525
0.444
0.522
0:438
0.451
0.506
0.512
0.543
0.549
0.420
0.546
0.438
0.481
0.451
712
810
752
783
860
790
723
735
801
804
892
724
741
683
725
673
171
176
151
204
171
201
167
129
231
177
213
148
171
131
141
123
Team Batting
Average
0.250
0.275
0.271
0.267
0.280
0.267
0.260
0.275
0.262
0.275
0.274
0.263
0.251
0.254
0.274
0.256
On-Base
Percentage
0.321
0.339
0.333
0.335
0.354
0.336
0.330
0.337
0.329
0.342
0.354
0.325
0.322
0.322
0.337
0.325
Batting Average
against Team
0.262
0.259
0.246
0.282
0.266
0.285
0.273
0.261
0.269
0.255
0.276
AFATARE
0.288
0.250
0.261
0.271
0.269
Team Earned-
Run Average
4.13
4.11
4.04
4.94
4.32
4.94
4.68
4.20
4.41
4.26
4.73
4.93
3.70
4.19
4.65
4.58
Expert Solution
This question has been solved!
Explore an expertly crafted, step-by-step solution for a thorough understanding of key concepts.
This is a popular solution!
Trending now
This is a popular solution!
Step by step
Solved in 5 steps

Follow-up Questions
Read through expert solutions to related follow-up questions below.
Follow-up Question
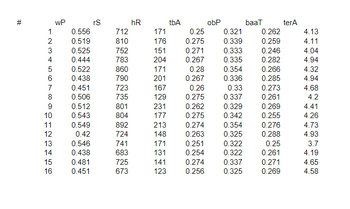
Please help step to step with R program with a final code for understanding thank you.

Transcribed Image Text:#
1
2
3
4
5
6
7
8
9
10
11
12
13
14
15
16
wP
0.556
0.519
0.525
0.444
0.522
0.438
0.451
0.506
0.512
0.543
0.549
0.42
0.546
0.438
0.481
0.451
rS
712
810
752
783
860
790
723
735
801
804
892
724
741
683
725
673
hR
obP
171
0.25 0.321 0.262
176
0.275
0.339
0.259
151
0.271
204
0.267
171
0.28
201 0.267
167
129
231
177
213
148
171
131
141
123
tbA
0.26
0.275
0.262
0.275
0.274
0.263
0.251
0.254
0.274
0.256
0.333
0.335
0.354
0.336
0.322
0.322
baaT
0.33
0.337
0.329
0.342
0.354
0.276
0.325 0.288
0.337
0.325
0.246
0.282
0.266
0.285
0.273
0.261
0.269
0.255
0.25
0.261
0.271
0.269
terA
4.13
4.11
4.04
4.94
4.32
4.94
4.68
4.2
4.41
4.26
4.73
4.93
3.7
4.19
4.65
4.58

Transcribed Image Text:Problem#9
34. The Best Predictor of the Winning Percentage The ultimate goal in any sport (besides having fun) is to win. One measure of
how well a team does is the winning percentage. In baseball, a lot of effort goes into figuring out the variable that best predicts
a team's winning percentage. The following data represent the winning percentages of teams in the National League along
with potential explanatory variables based on the 2007 season. Which variable do you think is the best predictor of winning
percentage? Why?
Team
Arizona
Atlanta
Chicago Cubs
Cincinnati
Colorado
Florida
Houston
Los Angeles
Milwaukee
New York Mets
Philadelphia
Pittsburgh
San Diego
San Francisco
St. Louis
Washington
Source: espn.com
Winning
Percentage Runs Scored Home Runs
0.556
0.519
0.525
0.444
0.522
0:438
0.451
0.506
0.512
0.543
0.549
0.420
0.546
0.438
0.481
0.451
712
810
752
783
860
790
723
735
801
804
892
724
741
683
725
673
171
176
151
204
171
201
167
129
231
177
213
148
171
131
141
123
Team Batting
Average
0.250
0.275
0.271
0.267
0.280
0.267
0.260
0.275
0.262
0.275
0.274
0.263
0.251
0.254
0.274
0.256
On-Base
Percentage
0.321
0.339
0.333
0.335
0.354
0.336
0.330
0.337
0.329
0.342
0.354
0.325
0.322
0.322
0.337
0.325
Batting Average
against Team
0.262
0.259
0.246
0.282
0.266
0.285
0.273
0.261
0.269
0.255
0.276
AFATARE
0.288
0.250
0.261
0.271
0.269
Team Earned-
Run Average
4.13
4.11
4.04
4.94
4.32
4.94
4.68
4.20
4.41
4.26
4.73
4.93
3.70
4.19
4.65
4.58
Solution
Recommended textbooks for you

MATLAB: An Introduction with Applications
Statistics
ISBN:
9781119256830
Author:
Amos Gilat
Publisher:
John Wiley & Sons Inc

Probability and Statistics for Engineering and th…
Statistics
ISBN:
9781305251809
Author:
Jay L. Devore
Publisher:
Cengage Learning

Statistics for The Behavioral Sciences (MindTap C…
Statistics
ISBN:
9781305504912
Author:
Frederick J Gravetter, Larry B. Wallnau
Publisher:
Cengage Learning

MATLAB: An Introduction with Applications
Statistics
ISBN:
9781119256830
Author:
Amos Gilat
Publisher:
John Wiley & Sons Inc

Probability and Statistics for Engineering and th…
Statistics
ISBN:
9781305251809
Author:
Jay L. Devore
Publisher:
Cengage Learning

Statistics for The Behavioral Sciences (MindTap C…
Statistics
ISBN:
9781305504912
Author:
Frederick J Gravetter, Larry B. Wallnau
Publisher:
Cengage Learning

Elementary Statistics: Picturing the World (7th E…
Statistics
ISBN:
9780134683416
Author:
Ron Larson, Betsy Farber
Publisher:
PEARSON

The Basic Practice of Statistics
Statistics
ISBN:
9781319042578
Author:
David S. Moore, William I. Notz, Michael A. Fligner
Publisher:
W. H. Freeman

Introduction to the Practice of Statistics
Statistics
ISBN:
9781319013387
Author:
David S. Moore, George P. McCabe, Bruce A. Craig
Publisher:
W. H. Freeman