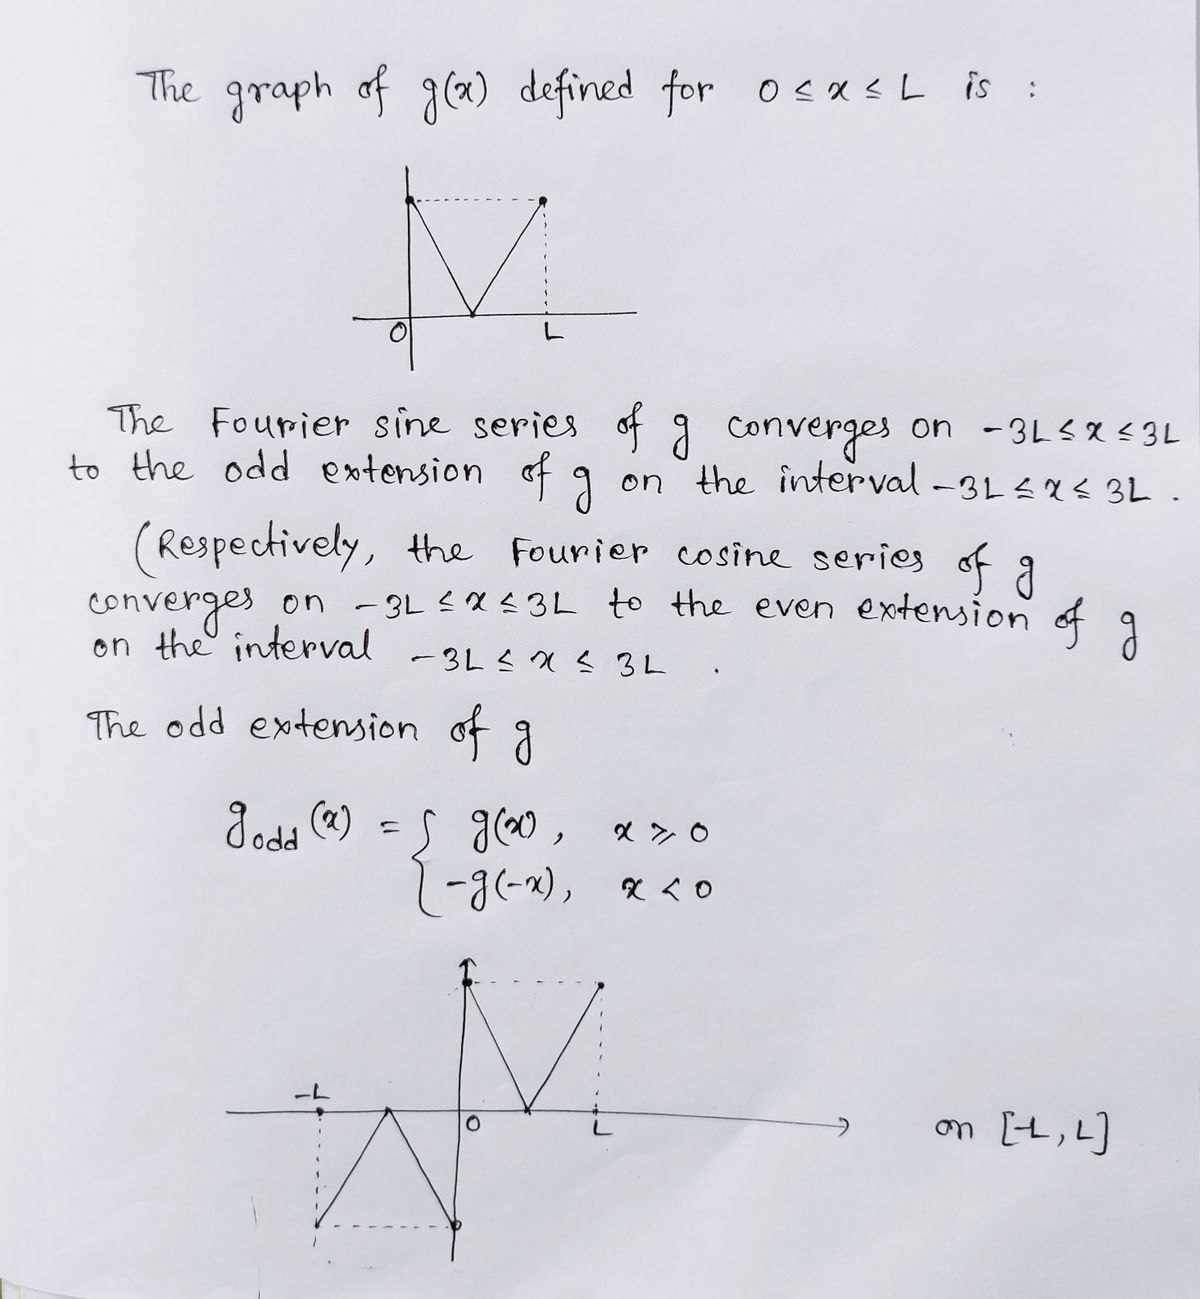
Problem 14 The graph of a function g(x) defined for OEXEL is drawn in the diagram. sketch the function to which the Fourtier sine serves cod of g converges on - 34≤x≤ 3L. Use X's to mark points showing what the Former sine suries converges to at jump dis continuities
Problem 14 The graph of a function g(x) defined for OEXEL is drawn in the diagram. sketch the function to which the Fourtier sine serves cod of g converges on - 34≤x≤ 3L. Use X's to mark points showing what the Former sine suries converges to at jump dis continuities
Advanced Engineering Mathematics
10th Edition
ISBN:9780470458365
Author:Erwin Kreyszig
Publisher:Erwin Kreyszig
Chapter2: Second-order Linear Odes
Section: Chapter Questions
Problem 1RQ
Related questions
Question
1400
Please show all the steps

Transcribed Image Text:**Problem 14: Fourier Sine Series Convergence**
The graph of a function \( g(x) \) defined for \( 0 \leq x \leq L \) is drawn in the diagram. Sketch the function to which the Fourier sine series of \( g \) converges on \(-3L \leq x \leq 3L\). Use X's to mark points showing what the Fourier sine series converges to at jump discontinuities.
**Diagram Explanation:**
The diagram is a graph on an x-y axis:
- The x-axis runs horizontally with two marked points: \( 0 \) and \( L \).
- The y-axis runs vertically and depicts a point above the x-axis, connected by lines forming a graphical shape:
- A vertical arrow originates from the x-axis at \( 0 \) indicating a range or direction.
- A line descends to a point at \( x = L/2 \) on the x-axis.
- Another line ascends back to the y-axis at \( x = L \).
Note: Points where the Fourier sine series converges at discontinuities should be marked with X's on the graph to illustrate convergence behavior.
Expert Solution
Step 1

Step by step
Solved in 2 steps with 2 images

Recommended textbooks for you

Advanced Engineering Mathematics
Advanced Math
ISBN:
9780470458365
Author:
Erwin Kreyszig
Publisher:
Wiley, John & Sons, Incorporated

Numerical Methods for Engineers
Advanced Math
ISBN:
9780073397924
Author:
Steven C. Chapra Dr., Raymond P. Canale
Publisher:
McGraw-Hill Education

Introductory Mathematics for Engineering Applicat…
Advanced Math
ISBN:
9781118141809
Author:
Nathan Klingbeil
Publisher:
WILEY

Advanced Engineering Mathematics
Advanced Math
ISBN:
9780470458365
Author:
Erwin Kreyszig
Publisher:
Wiley, John & Sons, Incorporated

Numerical Methods for Engineers
Advanced Math
ISBN:
9780073397924
Author:
Steven C. Chapra Dr., Raymond P. Canale
Publisher:
McGraw-Hill Education

Introductory Mathematics for Engineering Applicat…
Advanced Math
ISBN:
9781118141809
Author:
Nathan Klingbeil
Publisher:
WILEY

Mathematics For Machine Technology
Advanced Math
ISBN:
9781337798310
Author:
Peterson, John.
Publisher:
Cengage Learning,

