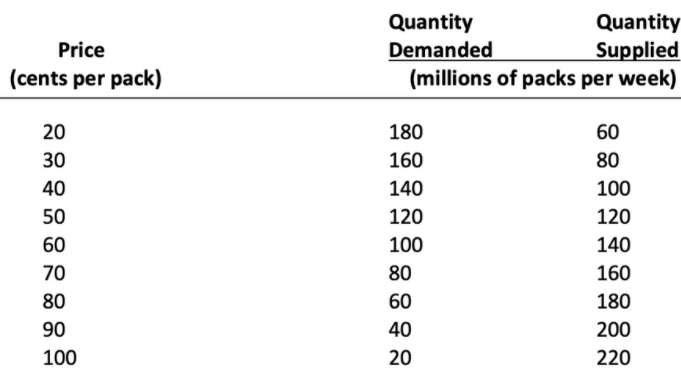
Problem 1. The table below shows the demand and supply schedules for gum: Quantity Demanded (millions of packs per week) Quantity Supplied Price (cents per pack) 20 180 60 30 160 80 40 140 100 50 120 120 60 100 140 70 80 160 80 60 180 90 40 200 100 20 220 a. Draw a graph of the market for gum and mark in the equilibrium price and quantity. b. Suppose that the price of gum is 70¢ a pack. Describe the situation in the gum market and explain how the price adjusts. c. Suppose that the price of gum is 30¢ a pack. Describe the situation in the gum market and explain how the price adjusts.


We’ll answer the first question since the exact one wasn’t specified. Please submit a new question specifying the one you’d like answered.
Answer (1):
Given,
(a). Equilibrium occurs where the demand and supply curves intersect each other. The corresponding quantity is the equilibrium quantity and the corresponding price is the equilibrium price.
Graphical presentation:
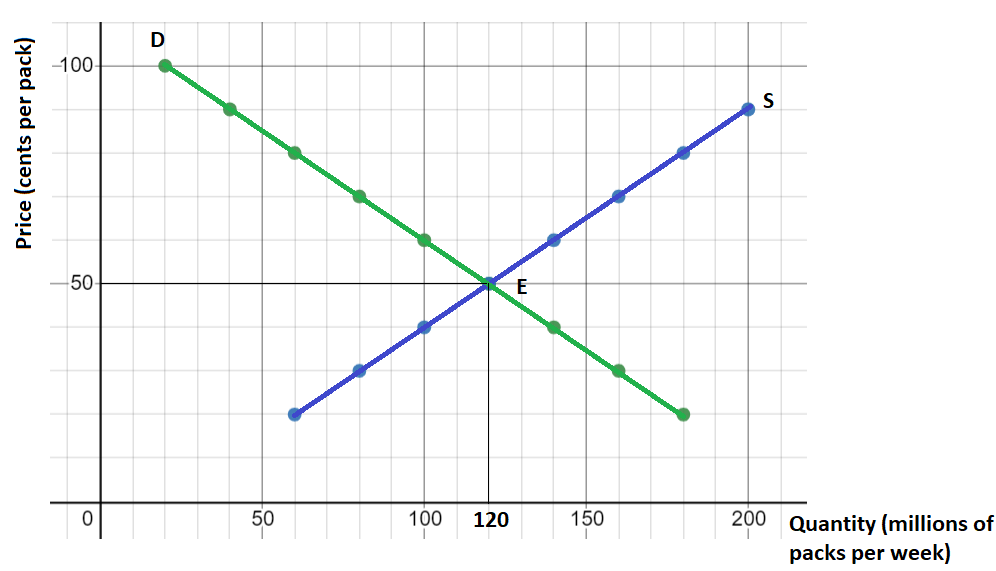
According to the above figure, the x-axis measures the quantity of gum, and the y-axis measures the price of gum. D is the demand curve and S is the supply curve of gum. Equilibrium in this market occurs at point E because at point E the demand and the supply curve intersect each other. The corresponding equilibrium quantity is 120 million packs and the equilibrium price is 50 cents per pack.

Trending now
This is a popular solution!

Step by step
Solved in 3 steps with 2 images


