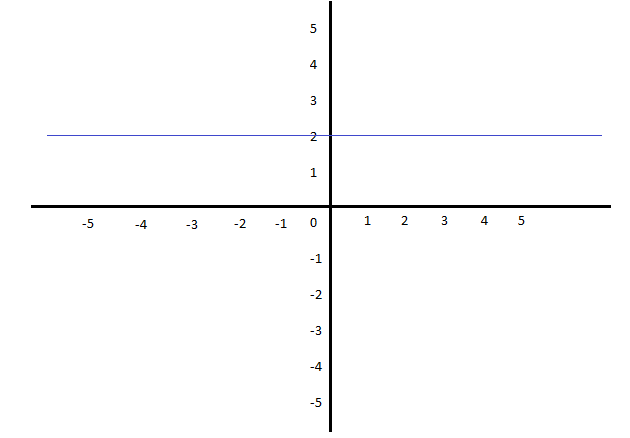
**Graph: \( y > 2 \)** This image shows a coordinate plane with the graph of the inequality \( y > 2 \). The coordinate plane is marked with a grid and labeled with both x and y axes ranging from -5 to 5. **Graph Explanation:** - **Axes and Grid:** The graph is on a standard Cartesian coordinate plane with both the x-axis and y-axis ranging from -5 to 5. The grid lines divide the plane into equal units. - **Inequality \( y > 2 \):** The graph represents the region where the y-values are greater than 2. This area would typically be shaded above the horizontal line \( y = 2 \) to indicate all the points (x, y) that satisfy the inequality. - **Tools and Features:** - There is a "Clear All" button that likely allows users to reset or remove any drawn lines or shading. - A "Draw" tool with options that appear to allow drawing or shading areas on the graph. - There is a "Submit Question" button, indicating this graph might be part of an interactive question or assessment. **Note:** In a typical graphing tool for inequalities, the line \( y = 2 \) might be dashed to indicate that points on the line are not included in the solution set (as the inequality is strictly greater than 2, not greater than or equal to 2). For further assistance, there is a "Question Help: Video" option that suggests users can access a tutorial or explanation video.
**Graph: \( y > 2 \)** This image shows a coordinate plane with the graph of the inequality \( y > 2 \). The coordinate plane is marked with a grid and labeled with both x and y axes ranging from -5 to 5. **Graph Explanation:** - **Axes and Grid:** The graph is on a standard Cartesian coordinate plane with both the x-axis and y-axis ranging from -5 to 5. The grid lines divide the plane into equal units. - **Inequality \( y > 2 \):** The graph represents the region where the y-values are greater than 2. This area would typically be shaded above the horizontal line \( y = 2 \) to indicate all the points (x, y) that satisfy the inequality. - **Tools and Features:** - There is a "Clear All" button that likely allows users to reset or remove any drawn lines or shading. - A "Draw" tool with options that appear to allow drawing or shading areas on the graph. - There is a "Submit Question" button, indicating this graph might be part of an interactive question or assessment. **Note:** In a typical graphing tool for inequalities, the line \( y = 2 \) might be dashed to indicate that points on the line are not included in the solution set (as the inequality is strictly greater than 2, not greater than or equal to 2). For further assistance, there is a "Question Help: Video" option that suggests users can access a tutorial or explanation video.
A First Course in Probability (10th Edition)
10th Edition
ISBN:9780134753119
Author:Sheldon Ross
Publisher:Sheldon Ross
Chapter1: Combinatorial Analysis
Section: Chapter Questions
Problem 1.1P: a. How many different 7-place license plates are possible if the first 2 places are for letters and...
Related questions
Question

Transcribed Image Text:**Graph: \( y > 2 \)**
This image shows a coordinate plane with the graph of the inequality \( y > 2 \). The coordinate plane is marked with a grid and labeled with both x and y axes ranging from -5 to 5.
**Graph Explanation:**
- **Axes and Grid:** The graph is on a standard Cartesian coordinate plane with both the x-axis and y-axis ranging from -5 to 5. The grid lines divide the plane into equal units.
- **Inequality \( y > 2 \):** The graph represents the region where the y-values are greater than 2. This area would typically be shaded above the horizontal line \( y = 2 \) to indicate all the points (x, y) that satisfy the inequality.
- **Tools and Features:**
- There is a "Clear All" button that likely allows users to reset or remove any drawn lines or shading.
- A "Draw" tool with options that appear to allow drawing or shading areas on the graph.
- There is a "Submit Question" button, indicating this graph might be part of an interactive question or assessment.
**Note:** In a typical graphing tool for inequalities, the line \( y = 2 \) might be dashed to indicate that points on the line are not included in the solution set (as the inequality is strictly greater than 2, not greater than or equal to 2).
For further assistance, there is a "Question Help: Video" option that suggests users can access a tutorial or explanation video.
Expert Solution
Step 1
Given
First step we draw a line y = 2 a horizontal line as shown below

Step by step
Solved in 2 steps with 2 images

Recommended textbooks for you

A First Course in Probability (10th Edition)
Probability
ISBN:
9780134753119
Author:
Sheldon Ross
Publisher:
PEARSON


A First Course in Probability (10th Edition)
Probability
ISBN:
9780134753119
Author:
Sheldon Ross
Publisher:
PEARSON
