Plot the following equation on the graph given below. Please extend the graph all the way left and right.
Plot the following equation on the graph given below. Please extend the graph all the way left and right.
Advanced Engineering Mathematics
10th Edition
ISBN:9780470458365
Author:Erwin Kreyszig
Publisher:Erwin Kreyszig
Chapter2: Second-order Linear Odes
Section: Chapter Questions
Problem 1RQ
Related questions
Question
See attached image.
Studying for exam and caught up on these two.
Thanks
![5) **Task: Graph Plotting**
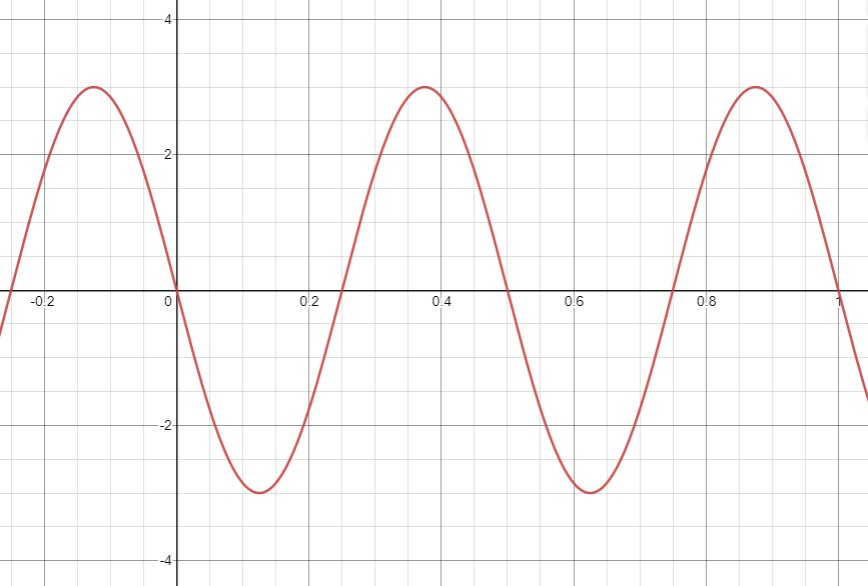
Plot the following equation on the given graph. Extend the graph all the way left and right.
\[ y = 3 \cdot \sin (4\pi t - \pi) \]
**Graph Characteristics:**
- **Axes:** The horizontal axis is labeled as \( t \) and ranges from -0.25 to 1. The vertical axis is labeled as \( y \) and ranges from -4 to 4.
- **Grid:** The graph is sectioned with dotted lines to help plot the sine wave.
6) **Task: Equation Identification**
Find the equation for the graph shown below using a sine function.
**Graph Description:**
- A sine wave is plotted with two complete cycles within the interval from 0 to 0.25 on the horizontal axis.
- **Amplitude:** The wave peaks at 12 and troughs at -12, giving an amplitude of 12.
- **Periodicity:** The wave completes two full cycles in the span of 0.25 units along the x-axis.
- **Axis Lines:** Both axes are marked with units to guide the identification of critical points in the wave.
The aim is to determine the general sine equation that fits the plotted curve.](/v2/_next/image?url=https%3A%2F%2Fcontent.bartleby.com%2Fqna-images%2Fquestion%2F88ce7fe7-6055-4d88-a2fe-fb962619b6d1%2F37aa4bb6-b22d-4c83-a00c-dfb6a54b9c80%2Fdiht42_processed.png&w=3840&q=75)
Transcribed Image Text:5) **Task: Graph Plotting**
Plot the following equation on the given graph. Extend the graph all the way left and right.
\[ y = 3 \cdot \sin (4\pi t - \pi) \]
**Graph Characteristics:**
- **Axes:** The horizontal axis is labeled as \( t \) and ranges from -0.25 to 1. The vertical axis is labeled as \( y \) and ranges from -4 to 4.
- **Grid:** The graph is sectioned with dotted lines to help plot the sine wave.
6) **Task: Equation Identification**
Find the equation for the graph shown below using a sine function.
**Graph Description:**
- A sine wave is plotted with two complete cycles within the interval from 0 to 0.25 on the horizontal axis.
- **Amplitude:** The wave peaks at 12 and troughs at -12, giving an amplitude of 12.
- **Periodicity:** The wave completes two full cycles in the span of 0.25 units along the x-axis.
- **Axis Lines:** Both axes are marked with units to guide the identification of critical points in the wave.
The aim is to determine the general sine equation that fits the plotted curve.
Expert Solution
Step 1
(5) The graph of is as follows:

Step by step
Solved in 4 steps with 3 images

Recommended textbooks for you

Advanced Engineering Mathematics
Advanced Math
ISBN:
9780470458365
Author:
Erwin Kreyszig
Publisher:
Wiley, John & Sons, Incorporated

Numerical Methods for Engineers
Advanced Math
ISBN:
9780073397924
Author:
Steven C. Chapra Dr., Raymond P. Canale
Publisher:
McGraw-Hill Education

Introductory Mathematics for Engineering Applicat…
Advanced Math
ISBN:
9781118141809
Author:
Nathan Klingbeil
Publisher:
WILEY

Advanced Engineering Mathematics
Advanced Math
ISBN:
9780470458365
Author:
Erwin Kreyszig
Publisher:
Wiley, John & Sons, Incorporated

Numerical Methods for Engineers
Advanced Math
ISBN:
9780073397924
Author:
Steven C. Chapra Dr., Raymond P. Canale
Publisher:
McGraw-Hill Education

Introductory Mathematics for Engineering Applicat…
Advanced Math
ISBN:
9781118141809
Author:
Nathan Klingbeil
Publisher:
WILEY

Mathematics For Machine Technology
Advanced Math
ISBN:
9781337798310
Author:
Peterson, John.
Publisher:
Cengage Learning,

