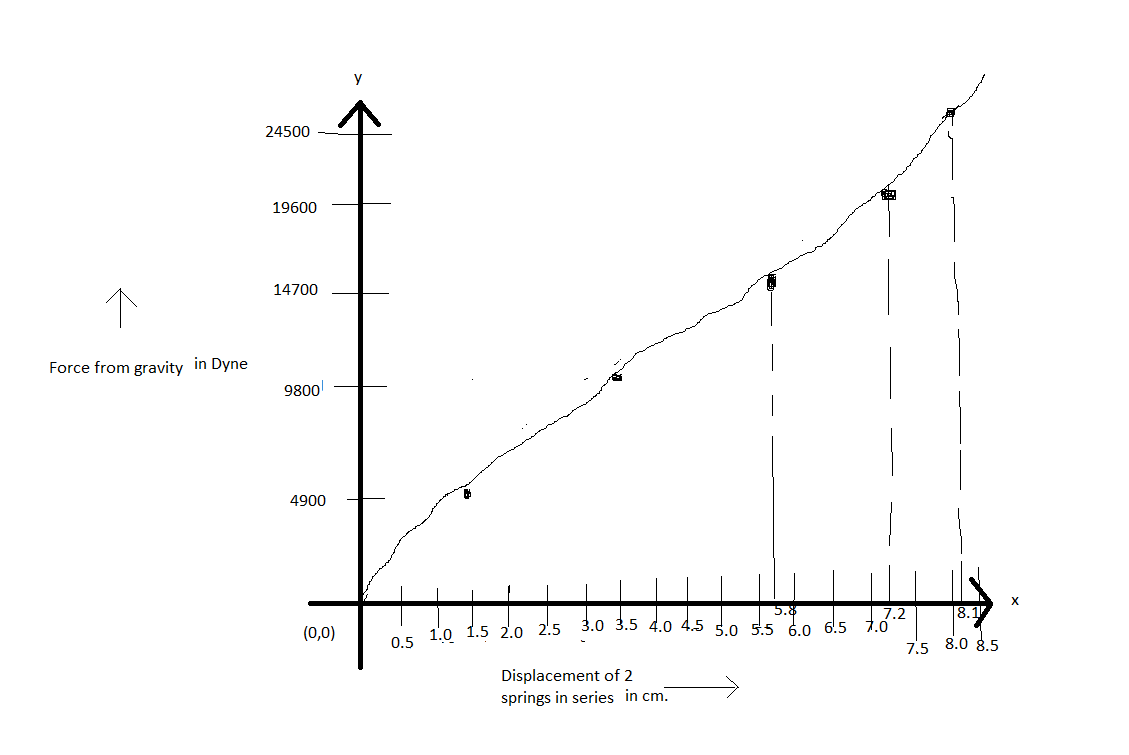
Plot a graph of Displacement of 2 springs in a series (x axis) and force from gravity (y axis) and measure the slope. Plot a graph of Displacement of 2 springs in parallel (x axis) and force from gravity (y axis) and measure the slope.
Plot a graph of Displacement of 2 springs in a series (x axis) and force from gravity (y axis) and measure the slope. Plot a graph of Displacement of 2 springs in parallel (x axis) and force from gravity (y axis) and measure the slope.

Related questions
Question
- Plot a graph of Displacement of 2 springs in a series (x axis) and force from gravity (y axis) and measure the slope.
- Plot a graph of Displacement of 2 springs in parallel (x axis) and force from gravity (y axis) and measure the slope.

Transcribed Image Text:Force (F)
from
Spring 1
displacement
(x)
Spring 2
displacement
(x)
Displacement of | Displacement of.
2 springs in
series
Mass
2 springs in
parallel
spring
mass
5g
3 mm (70-67)
15 mm (50-35)
5 mm (70-
65)
15 mm (70- | 35 mm (100-65)
55)
0.049 N
15 mm (100-85)
10g
0.098 N
10 mm (70-60)
10 mm (50-40)
15g
0.147 N
20 mm (70-50)
25 mm (70-
58 mm (100-42)
15 mm (50-35)
45)
40 mm (70-
30)
20g
0.196 N
25 mm (70-45)
72 mm (100-28)
20 mm (50-30)
25g
30 mm (70-40)
81 mm (100-19)
30 mm (50-20)
60 mm (70-
10)
0.245 N
Expert Solution
Step 1
1)The required plot is as follows

Step by step
Solved in 2 steps with 2 images
