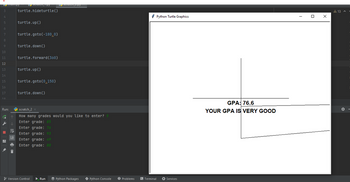
Please solve it using Python and provide explanation Turtle Graphics is a Python feature like a drawing board, which lets us command a turtle to draw all over it! We can use functions like forward(…) and right(…) which can move the turtle around. Commonly used turtle methods are found in the posted pdf file “turtle — Turtle graphics — Python 3.7.1rc1 documentation” To make use of the turtle methods and functionalities, we need to import turtle. “turtle” comes packed with the standard Python package and need not be installed externally. The roadmap for executing a turtle program follows 3 steps: 1. Import the turtle module 2. Create a turtle to control. 3. Draw around using the turtle methods. Problem: Based on your transcript grades; you are required to do the following: 1- A prompting message asks you how many grades you are going to enter. 2- Enter your real grades for all terms that you have done as an integer numbers, and then you need to store the input grades in a list. 3- Find your GPA with 2 decimal points 4- You are required to show your grades’ scale as the below graph and print the GPA (with 2 decimal points) with comments. Hence, if your GPA is greater than 70 then you will get comments “YOUR GPA is V.GOOD”; if your GPA between 50-69 then the message will be “YOUR GPA is LOW”; otherwise (less than 50) the message will be “You have first warning” Based on what you have learned in this course and using the appropriate commands, you are asked to Design the algorithm and implement a python program that draws the below diagram using the turtle. You should consider the following points in your solution: 1- The x-axis has a length of 180 units, while the y-axis is 150 units. 2- When you are plotting the values, make sure to multiply the value of the number of grade by 20 in order to make an acceptable distance between the dots. The value of the grades should remain the same. 3- The dots should be in red. 4- Over each dot, you need to write the grade. 5- In your graph, you should hide the turtle prompt. 6- Make sure to set properly the starting position (x & y) of your drawing, to maintain the above diagram.
Please solve it using Python and provide explanation
Turtle Graphics is a Python feature like a drawing board, which lets us command a turtle to draw all over it! We can use functions like forward(…) and right(…) which can move the turtle around. Commonly used turtle methods are found in the posted pdf file “turtle — Turtle graphics — Python 3.7.1rc1 documentation”
To make use of the turtle methods and functionalities, we need to import turtle. “turtle” comes packed with the standard Python package and need not be installed externally. The roadmap for executing a turtle program follows 3 steps:
1. Import the turtle module
2. Create a turtle to control.
3. Draw around using the turtle methods.
Problem:
Based on your transcript grades; you are required to do the following:
1- A prompting message asks you how many grades you are going to enter.
2- Enter your real grades for all terms that you have done as an integer numbers, and then you need to store the input grades in a list.
3- Find your GPA with 2 decimal points
4- You are required to show your grades’ scale as the below graph and print the GPA (with 2 decimal points) with comments. Hence, if your GPA is greater than 70 then you will get comments “YOUR GPA is V.GOOD”; if your GPA between 50-69 then the message will be “YOUR GPA is LOW”; otherwise (less than 50) the message will be “You have first warning”
Based on what you have learned in this course and using the appropriate commands, you are asked to Design the
You should consider the following points in your solution:
1- The x-axis has a length of 180 units, while the y-axis is 150 units.
2- When you are plotting the values, make sure to multiply the value of the number of grade by 20 in order to make an acceptable distance between the dots. The value of the grades should remain the same.
3- The dots should be in red.
4- Over each dot, you need to write the grade.
5- In your graph, you should hide the turtle prompt.
6- Make sure to set properly the starting position (x & y) of your drawing, to maintain the above diagram.
7- Copy and paste your code from IDLE to the Answer booklet (don’t put your code as a screenshot)
8- Provide Screenshots for the output

Trending now
This is a popular solution!
Step by step
Solved in 3 steps with 1 images

hello, can you please modify the code because i have issue with the output, am getting different output which is not right!!


