Please need all (a, b, c)


Contingency Table
A contingency table can be defined as the visual representation of the relationship between two or more categorical variables that can be evaluated and registered. It is a categorical version of the scatterplot, which is used to investigate the linear relationship between two variables. A contingency table is indeed a type of frequency distribution table that displays two variables at the same time.
Binomial Distribution
Binomial is an algebraic expression of the sum or the difference of two terms. Before knowing about binomial distribution, we must know about the binomial theorem.
Note:- Please need all (a, b, c) answers to this question.


(a)
The scatterplot is obtained here by using EXCEL. The software procedure is given below:
- In first column enter data values of x.
- In second column enter data values of y.
- Select Insert > Scatter under Charts.
- Select Design > Chart Layouts > Layout 9.
- Click OK.
The output using EXCEL is as follows:
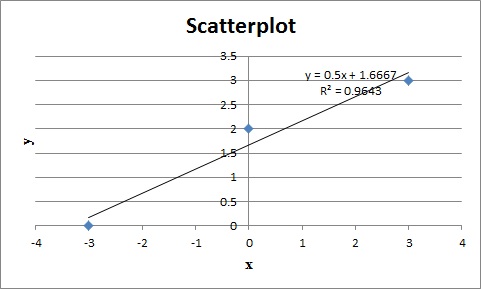
From the output, Option 1 graph is appropriate.
Correct Answer: Option 1.

Step by step
Solved in 2 steps with 1 images


