Please help with the hw question attached. The 2 imaged are part of 1 question.

MATLAB: An Introduction with Applications
6th Edition
ISBN:9781119256830
Author:Amos Gilat
Publisher:Amos Gilat
Chapter1: Starting With Matlab
Section: Chapter Questions
Problem 1P

Related questions
Question
Please help with the hw question attached. The 2 imaged are part of 1 question.

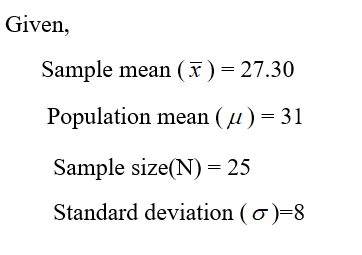
Transcribed Image Text:Consider Ho:H = 31 versus H1: µ + 31. A random sample of 25 observations taken from this population produced a sample mean of 27.30. The population is normally distributed with o = 8.
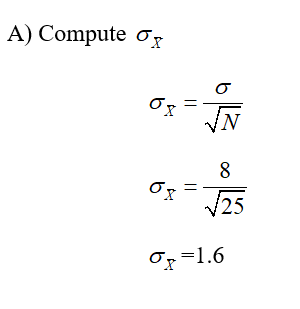
(a) Compute oz. Round the answer to four decimal places.
*1
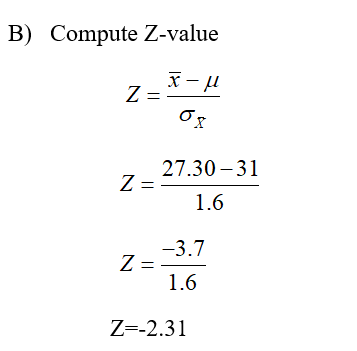
(b) Compute z value. Round the answer to two decimal places.
*2
z =
(c) Find area to the left of z-value on the standard normal distribution.
th
answer to four decimal places.
'3
The area =
(d) Find p-value. Round the answer to four decimal places.
p-value =

Transcribed Image Text:Consider Ho:µ = 31 versus H1: µ # 31. A random sample of 25 observations taken from this population produced a sample mean of 27.30. The population is normally distributed with o = 8.
Note: Use Table IV in Appendix C to compute the probabilities.
(a) Calculate the p-value.
(b) Considering the p-value of part (a), would you reject the null hypothesis if the test were made at the significance level of 0.05?
(c) Considering the p-value of part (a), would you reject the null hypothesis if the test were made at the significance level of 0.01?
Recall the following from section 9.2 of the text.
The p-value or probability-value approach.
(1) We reject the null hypothesis if p-value s a or a z p-value.
We do not reject the null hypothesis if p-value > a or da < p-value.
(2) For a one-tailed test, the p-value is given by the area in the tail of the sampling distribution curve beyond the observed value of the sample statistic.
For a two-tailed test, the p-value is given by twice the area in the tail of the sampling distribution curve beyond the observed value of the sample statistic.
(3) To find the area in the tail of the sampling distribution curve (we use normal distribution here), we first find the value of z corresponding to the observed value of X using the formula:
天ール
る
where oz =
n = sample size, and u and o are the population mean and standard deviation. We call this z value the observed value of z.
n
Expert Solution
Step 1

Step by step
Solved in 2 steps with 3 images

Knowledge Booster


Learn more about
Need a deep-dive on the concept behind this application? Look no further. Learn more about this topic, statistics and related others by exploring similar questions and additional content below.Recommended textbooks for you
MATLAB: An Introduction with Applications
Statistics
ISBN:
9781119256830
Author:
Amos Gilat
Publisher:
John Wiley & Sons Inc

Probability and Statistics for Engineering and th…
Statistics
ISBN:
9781305251809
Author:
Jay L. Devore
Publisher:
Cengage Learning

Statistics for The Behavioral Sciences (MindTap C…
Statistics
ISBN:
9781305504912
Author:
Frederick J Gravetter, Larry B. Wallnau
Publisher:
Cengage Learning
MATLAB: An Introduction with Applications
Statistics
ISBN:
9781119256830
Author:
Amos Gilat
Publisher:
John Wiley & Sons Inc
Probability and Statistics for Engineering and th…
Statistics
ISBN:
9781305251809
Author:
Jay L. Devore
Publisher:
Cengage Learning
Statistics for The Behavioral Sciences (MindTap C…
Statistics
ISBN:
9781305504912
Author:
Frederick J Gravetter, Larry B. Wallnau
Publisher:
Cengage Learning

Elementary Statistics: Picturing the World (7th E…
Statistics
ISBN:
9780134683416
Author:
Ron Larson, Betsy Farber
Publisher:
PEARSON

The Basic Practice of Statistics
Statistics
ISBN:
9781319042578
Author:
David S. Moore, William I. Notz, Michael A. Fligner
Publisher:
W. H. Freeman

Introduction to the Practice of Statistics
Statistics
ISBN:
9781319013387
Author:
David S. Moore, George P. McCabe, Bruce A. Craig
Publisher:
W. H. Freeman