ple. A test use the person has the virus and 8% of the time if False positive.) Let A be the event "the person i: = probability that a person has the virus given th r answer to the nearest tenth of a percent and c ne probability that a person does not have the viru Round your answer to the nearest tenth of a perce


Contingency Table
A contingency table can be defined as the visual representation of the relationship between two or more categorical variables that can be evaluated and registered. It is a categorical version of the scatterplot, which is used to investigate the linear relationship between two variables. A contingency table is indeed a type of frequency distribution table that displays two variables at the same time.
Binomial Distribution
Binomial is an algebraic expression of the sum or the difference of two terms. Before knowing about binomial distribution, we must know about the binomial theorem.

Let A be the event that the person is infected and B be the event that the person tests positive.
A virus infects one in every 200 people.
That is, P(A)= 1/200= 0.005
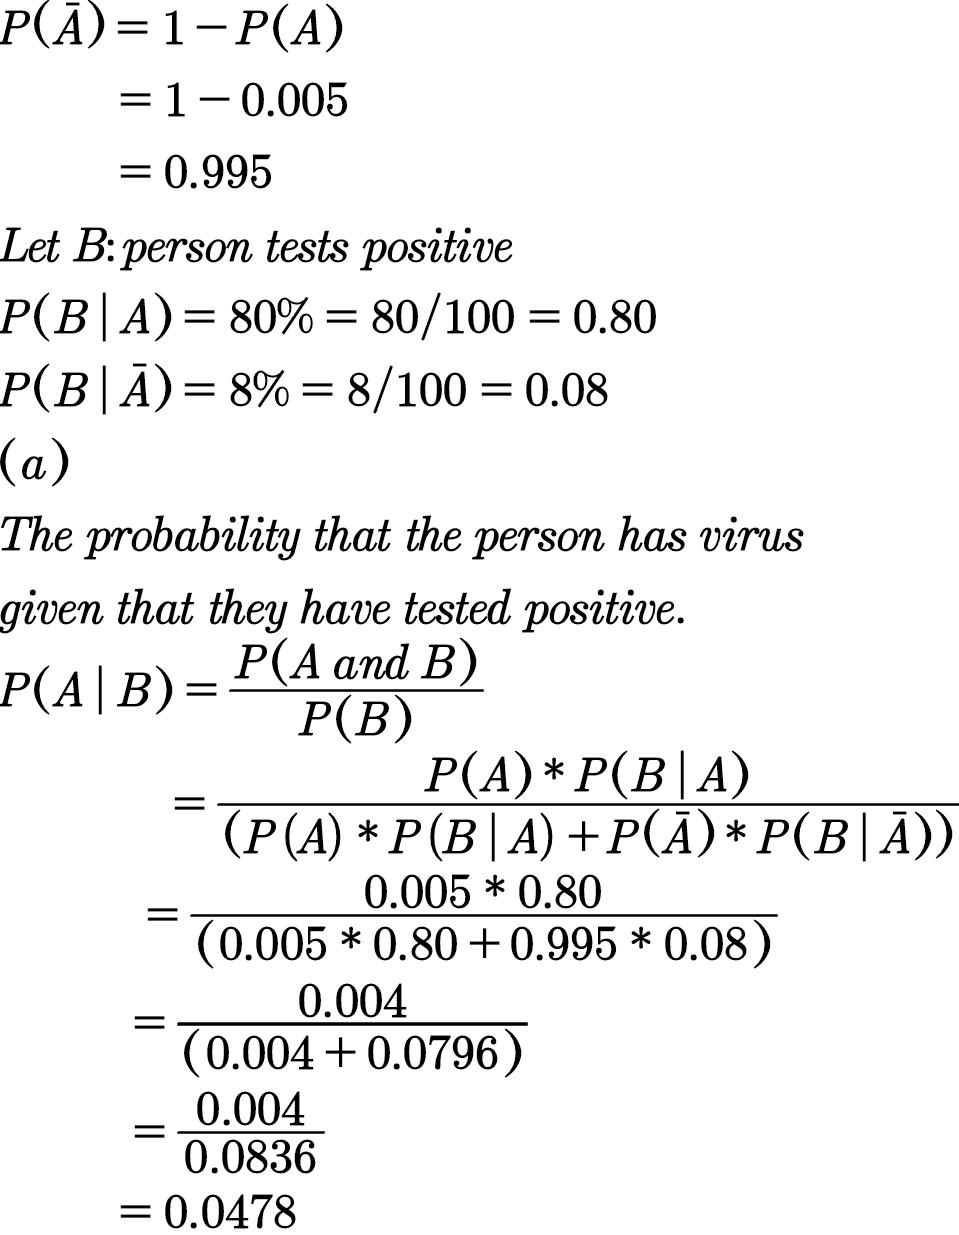
= 0.0478*100= 4.78≈ 4.8%( rounded to nearest tenth of a percent)
Thus, the probability that the person has a virus given that they tested positive is,
P(A|B)= 4.8 %

Step by step
Solved in 2 steps with 3 images


