OPTER a) Describe how you would simulate the number of cards of your favorite player you might find in five boxes of cereal. Choose the correct answer below. a card occurs. OA. Use single random digits. Let 0 to 3 represent a card and 4 to 9 represent no card. Count the number of digits until OB. Use single random digits. Let 0 to 3 represent a card and 4 to 9 represent no card. Examine random digits in groups of 5, counting the number of 5, counting the number OC. Use single random digits. Let 0 to 3 represent no card and 4 to 9 represent a card. Examine random digits in digits. Let 0 represent no card and 1 represent a card. Examine random digits in groups OD. Use single random of cards. groups of 5, counting the number of cards. of cards.
OPTER a) Describe how you would simulate the number of cards of your favorite player you might find in five boxes of cereal. Choose the correct answer below. a card occurs. OA. Use single random digits. Let 0 to 3 represent a card and 4 to 9 represent no card. Count the number of digits until OB. Use single random digits. Let 0 to 3 represent a card and 4 to 9 represent no card. Examine random digits in groups of 5, counting the number of 5, counting the number OC. Use single random digits. Let 0 to 3 represent no card and 4 to 9 represent a card. Examine random digits in digits. Let 0 represent no card and 1 represent a card. Examine random digits in groups OD. Use single random of cards. groups of 5, counting the number of cards. of cards.

MATLAB: An Introduction with Applications
6th Edition
ISBN:9781119256830
Author:Amos Gilat
Publisher:Amos Gilat
Chapter1: Starting With Matlab
Section: Chapter Questions
Problem 1P

Related questions
Question
100%
Hi! Can you help me solve these?

Transcribed Image Text:You are opening boxes of cereal one at a time looking for your favorite sports player's card, which is in 40% of the boxes. You buy 5 boxes to see how many cards you might get. Complete parts (a) though (d) below.
Click the icon to view the simulation results.
a) Describe how you would simulate the number of cards of your favorite player you might find in five boxes of cereal. Choose the correct answer below.
OA. Use single random digits. Let 0 to 3 represent a card and 4 to 9 represent no card. Count the number of digits until a card occurs.
OB. Use single random digits. Let 0 to 3 represent a card and 4 to 9 represent no card. Examine random digits in groups of 5, counting the number of cards.
OC. Use single random digits. Let 0 to 3 represent no card and 4 to 9 represent a card. Examine random digits in groups of 5, counting the number of cards.
OD. Use single random digits. Let 0 represent no card and 1 represent a card. Examine random digits in groups of 5, counting the number of cards.
b) Based on the results of a simulation of 1000 trials, estimate the following probabilities.
0
X
P(X=x)
(Round to three decimal places as needed.)
c) Find the actual probability model.
0
1
2
POL
X
P(X=x)
(Round to three decimal places as needed.)
d) Compare the distribution of outcomes in the simulation to the probability model. Select the correct answer below.
3
3
A
CA. The distribution of outcomes in the simulation appears to be similar to the probability model. The values are exactly the same.
OB. The distribution of outcomes in the simulation does not appear to be similar to the probability model. The values are not exactly the same.
OC. The distribution of outcomes in the simulation does not appear to be similar to the probability model. The estimated probabilities are not all within 0.05 of the actual probabilities.
OD. The distribution of outcomes in the simulation appears to be similar to the probability model. The estimated probabilities are all within 0.05 of the actual probabilities.
5
5
6 or more
6 or more

Transcribed Image Text:ds of your favorite player you might find in five boxes of cereal. Choose the correct answer below.
card and 4 to 9 represent no card. Count the number of digits until a card occurs
card and 4 to 9 represent no card. Examine random digits in groups of 5, counting the number of cards.
o card and 4 to 9 represent a card. Examine random digits in groups of 5, counting the number of cards.
ard and 1 represent a card Examing random dinits in groups of 5 counting the number of cards
stimate the f
on to the pro
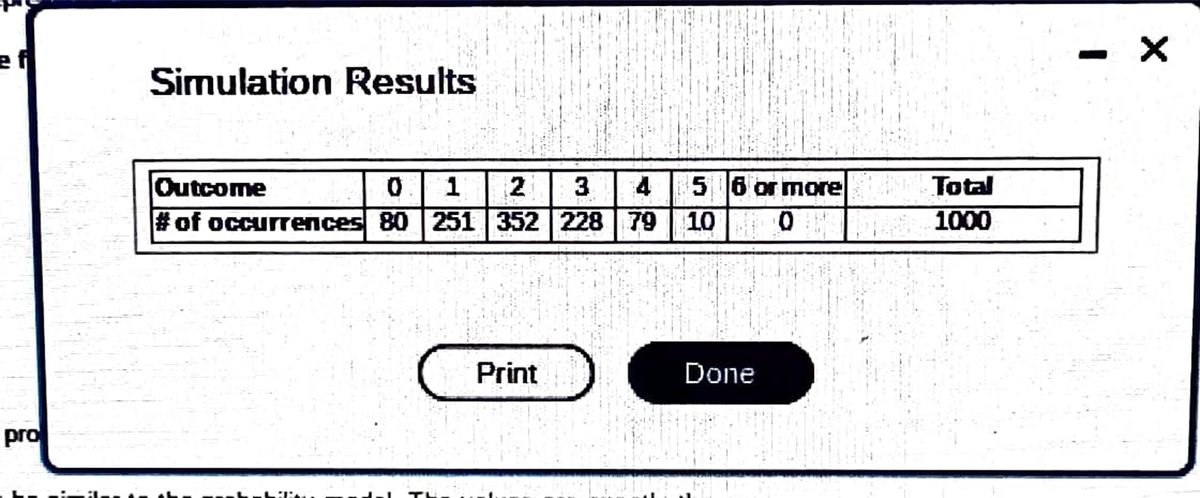
Simulation Results
Outcome
2 3 4
# of occurrences 80 251 352 228 79 10
Print
5 6 or more
0
Done
Total
1000
- X
4
4
ppears to be similar to the probability model. The values are exactly the same.
oes not appear to be similar to the probability model. The values are not exactly the same.
oes not appear to be similar to the probability model. The estimated probabilities are not all within 0.05 of the actual probabilities.
appears to be similar to the probability model. The estimated probabilities are all within 0.05 of the actual probabilities.
Expert Solution
Step 1
Here the given tale is

Trending now
This is a popular solution!

Step by step
Solved in 5 steps with 4 images

Recommended textbooks for you
MATLAB: An Introduction with Applications
Statistics
ISBN:
9781119256830
Author:
Amos Gilat
Publisher:
John Wiley & Sons Inc

Probability and Statistics for Engineering and th…
Statistics
ISBN:
9781305251809
Author:
Jay L. Devore
Publisher:
Cengage Learning

Statistics for The Behavioral Sciences (MindTap C…
Statistics
ISBN:
9781305504912
Author:
Frederick J Gravetter, Larry B. Wallnau
Publisher:
Cengage Learning
MATLAB: An Introduction with Applications
Statistics
ISBN:
9781119256830
Author:
Amos Gilat
Publisher:
John Wiley & Sons Inc
Probability and Statistics for Engineering and th…
Statistics
ISBN:
9781305251809
Author:
Jay L. Devore
Publisher:
Cengage Learning
Statistics for The Behavioral Sciences (MindTap C…
Statistics
ISBN:
9781305504912
Author:
Frederick J Gravetter, Larry B. Wallnau
Publisher:
Cengage Learning

Elementary Statistics: Picturing the World (7th E…
Statistics
ISBN:
9780134683416
Author:
Ron Larson, Betsy Farber
Publisher:
PEARSON

The Basic Practice of Statistics
Statistics
ISBN:
9781319042578
Author:
David S. Moore, William I. Notz, Michael A. Fligner
Publisher:
W. H. Freeman

Introduction to the Practice of Statistics
Statistics
ISBN:
9781319013387
Author:
David S. Moore, George P. McCabe, Bruce A. Craig
Publisher:
W. H. Freeman