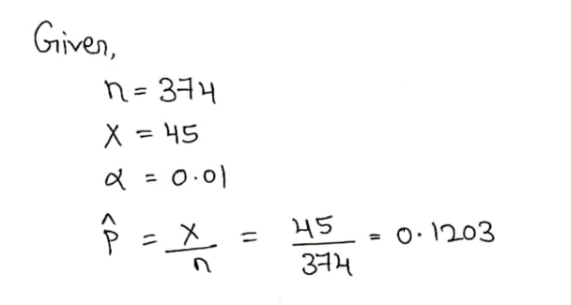
Only 18% of registered voters voted in the last election. Will voter participation change for the upcoming election? Of the 374 randomly selected registered voters surveyed, 45 of them will vote in the upcoming election. What can be concluded at the a = 0.01 level of significance? a. For this study, we should use Select an answer b. The null and alternative hypotheses would be: Но: ?vSelect an answer♥ (please enter a decimal) H1: ?vSelect an answer♥ (Please enter a decimal) c. The test statistic ?♥ = (please show your answer to 3 decimal places.) d. The p-value = (Please show your answer to 4 decimal places.) %3D
Only 18% of registered voters voted in the last election. Will voter participation change for the upcoming election? Of the 374 randomly selected registered voters surveyed, 45 of them will vote in the upcoming election. What can be concluded at the a = 0.01 level of significance? a. For this study, we should use Select an answer b. The null and alternative hypotheses would be: Но: ?vSelect an answer♥ (please enter a decimal) H1: ?vSelect an answer♥ (Please enter a decimal) c. The test statistic ?♥ = (please show your answer to 3 decimal places.) d. The p-value = (Please show your answer to 4 decimal places.) %3D

MATLAB: An Introduction with Applications
6th Edition
ISBN:9781119256830
Author:Amos Gilat
Publisher:Amos Gilat
Chapter1: Starting With Matlab
Section: Chapter Questions
Problem 1P

Related questions

Question
100%
Please answer B, C, & D.

Transcribed Image Text:Only 18% of registered voters voted in the last election. Will voter participation change for
the upcoming election? Of the 374 randomly selected registered voters surveyed, 45 of
them will vote in the upcoming election. What can be concluded at the a = 0.01 level of
significance?
a. For this study, we should use Select an answer
b. The null and alternative hypotheses would be:
Ho: ?v| Select an answer v
(please enter a decimal)
H1:
?v Select an answer v
|(Please enter a decimal)
c. The test statistic ?v =
(please show your answer to 3 decimal places.)
d. The p-value =
(Please show your answer to 4 decimal places.)
e. The p-value is ? v a
f. Based on this, we should Select an answer v the null hypothesis.
g. Thus, the final conclusion is that ...
The data suggest the population proportion is not significantly different from
18% at a = 0.01, so there is statistically significant evidence to conclude that
the percentage of registered voters who will vote in the upcoming election will
be equal to 18%.
O The data suggest the population proportion is not significantly different from
18% at a = 0.01, so there is statistically insignificant evidence to conclude that
the percentage of registered voters who will vote in the upcoming election will
be different from 18%.
%3D
O The data suggest the populaton proportion is significantly different from 18%
at a = 0.01, so there is statistically significant evidence to conclude that the
the percentage of all registered voters who will vote in the upcoming election
will be different from 18%.
%3D
Expert Solution
Step 1

Step by step
Solved in 2 steps with 3 images

Knowledge Booster


Learn more about
Need a deep-dive on the concept behind this application? Look no further. Learn more about this topic, statistics and related others by exploring similar questions and additional content below.Recommended textbooks for you
MATLAB: An Introduction with Applications
Statistics
ISBN:
9781119256830
Author:
Amos Gilat
Publisher:
John Wiley & Sons Inc

Probability and Statistics for Engineering and th…
Statistics
ISBN:
9781305251809
Author:
Jay L. Devore
Publisher:
Cengage Learning

Statistics for The Behavioral Sciences (MindTap C…
Statistics
ISBN:
9781305504912
Author:
Frederick J Gravetter, Larry B. Wallnau
Publisher:
Cengage Learning
MATLAB: An Introduction with Applications
Statistics
ISBN:
9781119256830
Author:
Amos Gilat
Publisher:
John Wiley & Sons Inc
Probability and Statistics for Engineering and th…
Statistics
ISBN:
9781305251809
Author:
Jay L. Devore
Publisher:
Cengage Learning
Statistics for The Behavioral Sciences (MindTap C…
Statistics
ISBN:
9781305504912
Author:
Frederick J Gravetter, Larry B. Wallnau
Publisher:
Cengage Learning

Elementary Statistics: Picturing the World (7th E…
Statistics
ISBN:
9780134683416
Author:
Ron Larson, Betsy Farber
Publisher:
PEARSON

The Basic Practice of Statistics
Statistics
ISBN:
9781319042578
Author:
David S. Moore, William I. Notz, Michael A. Fligner
Publisher:
W. H. Freeman

Introduction to the Practice of Statistics
Statistics
ISBN:
9781319013387
Author:
David S. Moore, George P. McCabe, Bruce A. Craig
Publisher:
W. H. Freeman