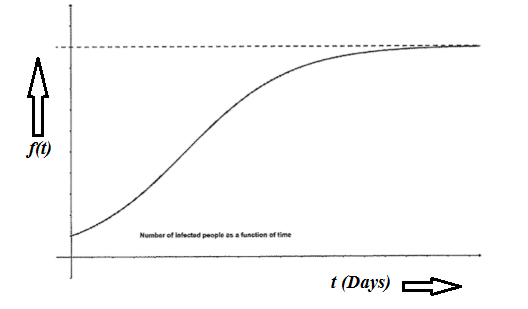
One of the possible models for the coronavirus is the logistic curve, shown here without scale. This curve shows the total number of cases of people infected with the virus. The rate of change for this curve is the number of ca es per day. 1. On the curve, mark the point at which the number of cases per day is greatest. What is a mathematical term for this point? 2. One of the criteria for re-opening activities is fourteen consecutive da s with a decreasing number of cases. Where is this on the curve? Number of Infected people as a function of time
One of the possible models for the coronavirus is the logistic curve, shown here without scale. This curve shows the total number of cases of people infected with the virus. The rate of change for this curve is the number of ca es per day. 1. On the curve, mark the point at which the number of cases per day is greatest. What is a mathematical term for this point? 2. One of the criteria for re-opening activities is fourteen consecutive da s with a decreasing number of cases. Where is this on the curve? Number of Infected people as a function of time

Calculus: Early Transcendentals
8th Edition
ISBN:9781285741550
Author:James Stewart
Publisher:James Stewart
Chapter1: Functions And Models
Section: Chapter Questions
Problem 1RCC: (a) What is a function? What are its domain and range? (b) What is the graph of a function? (c) How...

Related questions
Question

Transcribed Image Text:One of the possible models for the coronavirus is the logistic
curve, shown here without scale. This curve shows the total number of cases of people
infected with the virus. The rate of change for this curve is the number of ca es per day.
1. On the curve, mark the point at which the number of cases per day is greatest. What
is a mathematical term for this point?
2. One of the criteria for re-opening activities is fourteen consecutive da s with a decreasing
number of cases. Where is this on the curve?
Number of Infected people as a function of time
Expert Solution
Step 1
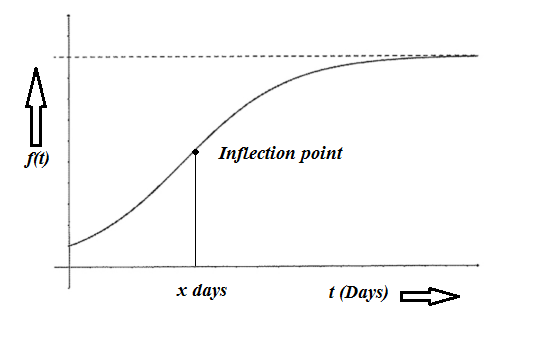
Label the graph as per the given statements in the question.
Step 2
The rate of change is the number of cases per day.
From the graph, the rate is maximum when concavity for f (t) changes from concavity up to concavity down.
This point is called the point of inflection.
Mark the point for inflection in the curve.

Step by step
Solved in 3 steps with 3 images

Recommended textbooks for you
Calculus: Early Transcendentals
Calculus
ISBN:
9781285741550
Author:
James Stewart
Publisher:
Cengage Learning

Thomas' Calculus (14th Edition)
Calculus
ISBN:
9780134438986
Author:
Joel R. Hass, Christopher E. Heil, Maurice D. Weir
Publisher:
PEARSON

Calculus: Early Transcendentals (3rd Edition)
Calculus
ISBN:
9780134763644
Author:
William L. Briggs, Lyle Cochran, Bernard Gillett, Eric Schulz
Publisher:
PEARSON
Calculus: Early Transcendentals
Calculus
ISBN:
9781285741550
Author:
James Stewart
Publisher:
Cengage Learning
Thomas' Calculus (14th Edition)
Calculus
ISBN:
9780134438986
Author:
Joel R. Hass, Christopher E. Heil, Maurice D. Weir
Publisher:
PEARSON
Calculus: Early Transcendentals (3rd Edition)
Calculus
ISBN:
9780134763644
Author:
William L. Briggs, Lyle Cochran, Bernard Gillett, Eric Schulz
Publisher:
PEARSON

Calculus: Early Transcendentals
Calculus
ISBN:
9781319050740
Author:
Jon Rogawski, Colin Adams, Robert Franzosa
Publisher:
W. H. Freeman


Calculus: Early Transcendental Functions
Calculus
ISBN:
9781337552516
Author:
Ron Larson, Bruce H. Edwards
Publisher:
Cengage Learning