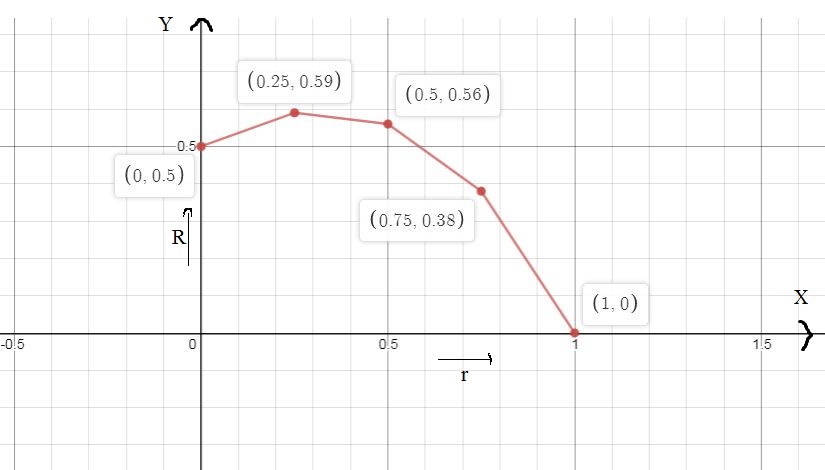
One key point we are interested in are optimum values, or places where R is the largest or smallest value it can be. Label these points on your graph as precisely as possible. For wind turbines, the maximum value is called the Betz limit.
R(r) = 1/2 (1+r) (1-r^2)


Note:- As per our guidelines, We’ll answer the first question since the exact one wasn’t specified. Please submit a new question specifying the one you’d like answered. Thank you.
and given table is
| r | 0 | 0.25 | 0.5 | 0.75 | 1 |
| R | 1 | 0.59 | 0.56 | 0.38 | 0 |
Note:- in given problem you don't mention about R, also not mentioned about, i have to use table or function to maximum or minimum value of R. If i use function to find values of R then i need some more information about R. So, i am using table to find values of R. If you need this graph for function then resubmit question with some information for R if it is output for wind turbine. Thank you.
Using table we draw a graph, to find largest values and smallest values of R
In graph, x- axis denotes input r and y-axis denotes output R

Step by step
Solved in 2 steps with 1 images


