observe the efficiency of students to see whether students do better when they study all at once or in intervals. One group of 12 participants participated in the survey after studying for one hour continuously. The other group of 12


Inverse Normal Distribution
The method used for finding the corresponding z-critical value in a normal distribution using the known probability is said to be an inverse normal distribution. The inverse normal distribution is a continuous probability distribution with a family of two parameters.
Mean, Median, Mode
It is a descriptive summary of a data set. It can be defined by using some of the measures. The central tendencies do not provide information regarding individual data from the dataset. However, they give a summary of the data set. The central tendency or measure of central tendency is a central or typical value for a probability distribution.
Z-Scores
A z-score is a unit of measurement used in statistics to describe the position of a raw score in terms of its distance from the mean, measured with reference to standard deviation from the mean. Z-scores are useful in statistics because they allow comparison between two scores that belong to different normal distributions.
The university conducted a study to observe the efficiency of students to see whether students do better when they study all at once or in intervals.
One group of 12 participants participated in the survey after studying for one hour continuously.
The other group of 12 participated in the survey after studying for three twenty-minute sessions.
As per the survey, results group 1 had a
Second group had a mean score of 86 and a variance of 100.
Assuming the normal populations, independent samples, and equal population variances conditions hold, are the mean test scores of these two groups significantly different at the 0.05 level?
The objective is to check whether the mean test scores of the two groups significantly differ at the 0.05 level.
Let  denote the mean of the participants participated in the survey after studying for one hour continuously.
Let  denote the mean of the participants participated in the survey after studying for three twenty-minute sessions.
The null hypothesis is that there is no difference between the mean test of scores between the two groups. That is,

The alternative hypothesis is that there is a difference between the mean test of the score between the two groups. That is,
The level of significance is,
group 1:
Sample mean,
Sample variance,
Sample Size, n1=12
Group 2:
Sample mean,
Sample variance,
Sample size, n2=12
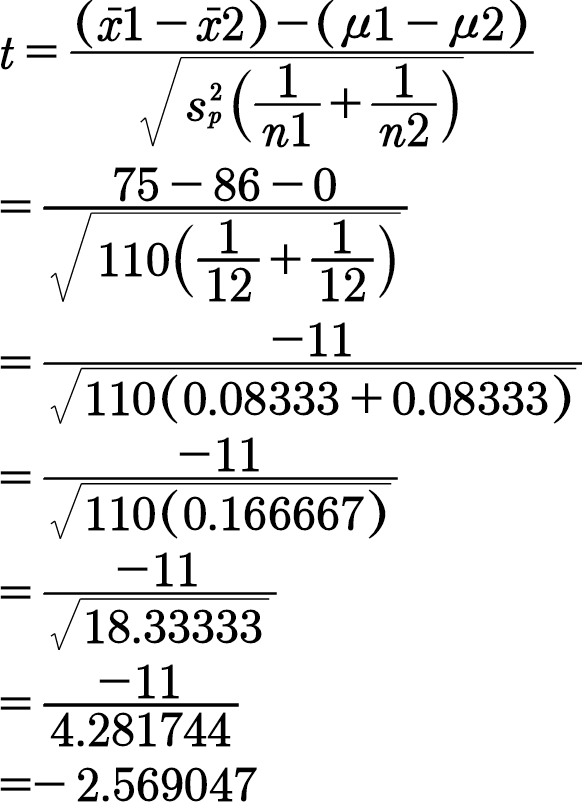
Given that the two variances are assumed to be equal, the test statistic is,
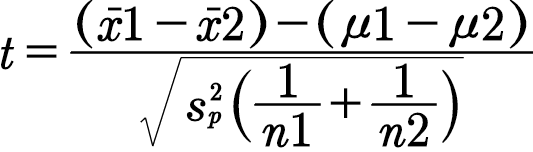
The formula for pooled variance is,
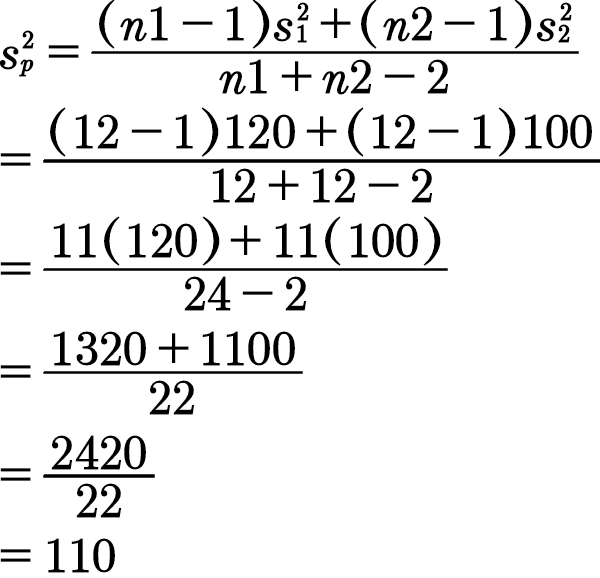
The test statistic is computed below.

Step by step
Solved in 5 steps with 13 images


