M(rapid eye movement) sleep is sleep during which most dreams occur. Each night a person has both REM and non-REM sleep. wever, it is thought that children have more REM sleep than adultst. Assume that REM sleep time is normally distributed for both dren and adults. A random sample of n, = 9 children (9 years old) showed that they had an average REM sleep time of x, = 2. urs per night. From previous studies, it is known that o, = 0.7 hour. Another random sample of n, = 9 adults showed that they %3! an average REM sleep time of x, 2.00 hours per night. Previous studies show that o, = 0.9 hour. Do these data indicate that average, children tend to have more REM sleep than adults? Use a 1% level of significance. (a) What is the level of significance? State the null and alternate hypotheses. (b) What sampling distribution will you use? What assumptions are you making? O The standard normal. We assume that both population distributions are approximately normal with known standard deviations. O The Student's t. We assume that both population distributions are approximately normal with known standard deviations. O The Student'st. We assume that both population distributions are approximately normal with unknown standard deviations. O The standard normal. We assume that both population distributions are approximately normal with unknown standa deviations. What is the value of the sample test statistic? (Test the difference u, - ,, Round your answer to two decimal places.) (c) Find (or estimate) the P-value. (Round your answer to four decimal places.)
M(rapid eye movement) sleep is sleep during which most dreams occur. Each night a person has both REM and non-REM sleep. wever, it is thought that children have more REM sleep than adultst. Assume that REM sleep time is normally distributed for both dren and adults. A random sample of n, = 9 children (9 years old) showed that they had an average REM sleep time of x, = 2. urs per night. From previous studies, it is known that o, = 0.7 hour. Another random sample of n, = 9 adults showed that they %3! an average REM sleep time of x, 2.00 hours per night. Previous studies show that o, = 0.9 hour. Do these data indicate that average, children tend to have more REM sleep than adults? Use a 1% level of significance. (a) What is the level of significance? State the null and alternate hypotheses. (b) What sampling distribution will you use? What assumptions are you making? O The standard normal. We assume that both population distributions are approximately normal with known standard deviations. O The Student's t. We assume that both population distributions are approximately normal with known standard deviations. O The Student'st. We assume that both population distributions are approximately normal with unknown standard deviations. O The standard normal. We assume that both population distributions are approximately normal with unknown standa deviations. What is the value of the sample test statistic? (Test the difference u, - ,, Round your answer to two decimal places.) (c) Find (or estimate) the P-value. (Round your answer to four decimal places.)

MATLAB: An Introduction with Applications
6th Edition
ISBN:9781119256830
Author:Amos Gilat
Publisher:Amos Gilat
Chapter1: Starting With Matlab
Section: Chapter Questions
Problem 1P

Related questions

Concept explainers
Contingency Table
A contingency table can be defined as the visual representation of the relationship between two or more categorical variables that can be evaluated and registered. It is a categorical version of the scatterplot, which is used to investigate the linear relationship between two variables. A contingency table is indeed a type of frequency distribution table that displays two variables at the same time.
Binomial Distribution
Binomial is an algebraic expression of the sum or the difference of two terms. Before knowing about binomial distribution, we must know about the binomial theorem.
Topic Video
Question
15)

Transcribed Image Text:Sketch the sampling distribution and show the area corresponding to the P-value.
Th
Z:
o-3
-2
1
-3
-2
-1
1
Si
P-
(F
o-3
-2
-1
3
o-3
-2
-1
13
S-
(d) Based on your answers in parts (a) to (c), will you reject or fail to reject the null hypothesis? Are the data statistically significant
at level a?
O At the a = 0.01 level, we fail to reject the null hypothesis and conclude the data are not statistically significant.
O At the a = 0.01 level, we reject the null hypothesis and conclude the data are statistically significant.
O At the a = 0.01 level, we fail to reject the null hypothesis and conclude the data are statistically significant.
O At the a = 0.01 level, we reject the null hypothesis and conclude the data are not statistically significant.
Coc
This
(e) Interpret your conclusion in the context of the application.
O Fail to reject the null hypothesis, there is insufficient evidence that the mean REM sleep time for children is more than for
adults
mark
use
mor
O Reject the null hypothesis, there is insufficient evidence that the mean REM seep time for children is more than for adults.
O Reject the null hypothesis, there is sufficient evidence that the mean REM sleep time for ch ldren is more than for adults.
O Fail to reject the null hypothesis, there is sufficient evidence that the mean REM sleep time for children is more than for adults.
Need Help?
Read It
EWatch It

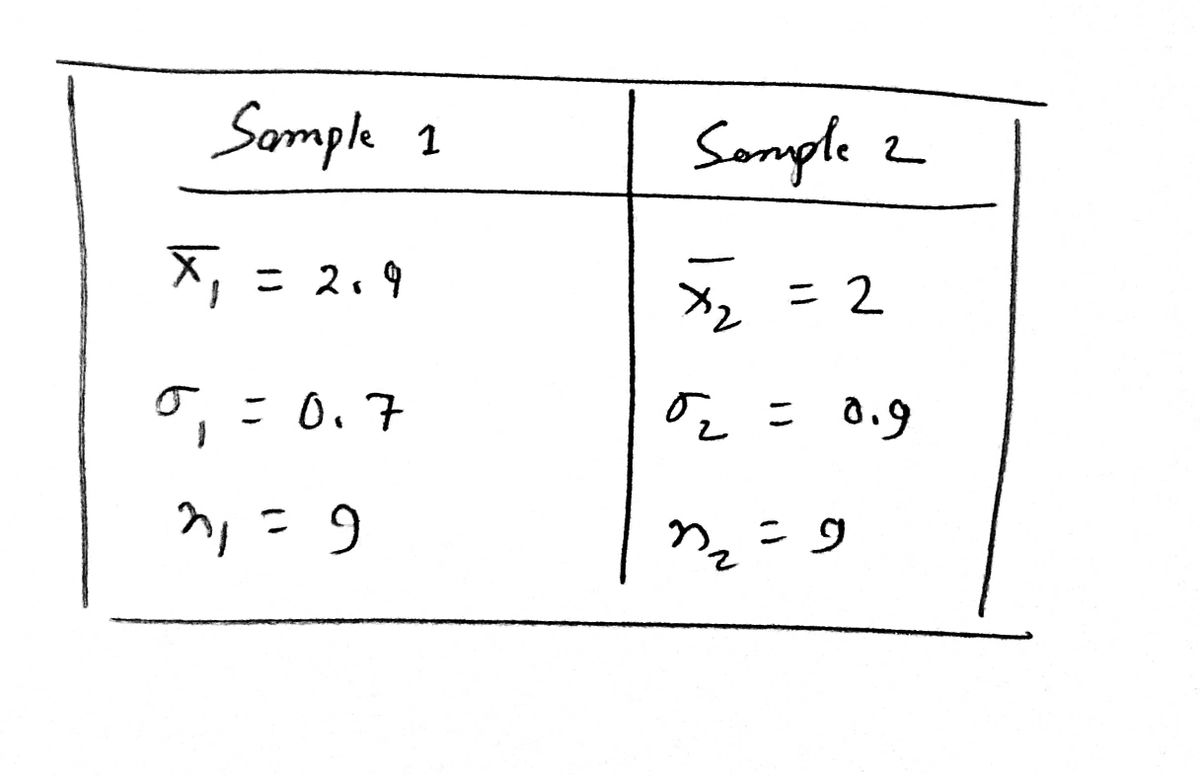
Transcribed Image Text:REM (rapid eye movement) sleep is sleep during which most dreams occur. Each night a person has both REM and non-REM sleep.
However, it is thought that children have more REM sleep than adultst, Assume that REM sleep time is normally distributed for both
children and adults. A random sample of n, = 9 children (9 years old) showed that they had an average REM sleep time of x,
= 2.9
hours per night. From previous studies, it is known that o, = 0.7 hour. Another random sample of n,
= 9 adults showed that they
had an average REM sleep time of x, = 2.00 hours per night. Previous studies show that a, = 0.9 hour. Do these data indicate that,
on average, children tend to have more REM sleep than adults? Use a 1% level of significance.
(a) What is the level of significance?
State the null and alternate hypotheses.
(b) What sampling distribution will you use? What assumptions are you making?
O The standard normal. We assume that both population distributions are approximately normal with known standard
deviations.
O The Student's t. We assume that both population distributions are approximately normal with known standard
deviations.
O The Student'st. We assume that both population distributions are approximately normal with unknown standard
deviations.
O The standard normal. We assume that both population distributions are approximately normal with unknown standard
deviations.
What is the value of the sample test statistic? (Test the difference u, -H,, Round your answer to two decimal places.)
(c) Find (or estimate) the P-value. (Round your answer to four decimal places.)
Expert Solution
Step 1

Step by step
Solved in 2 steps with 2 images

Knowledge Booster


Learn more about
Need a deep-dive on the concept behind this application? Look no further. Learn more about this topic, statistics and related others by exploring similar questions and additional content below.Recommended textbooks for you
MATLAB: An Introduction with Applications
Statistics
ISBN:
9781119256830
Author:
Amos Gilat
Publisher:
John Wiley & Sons Inc

Probability and Statistics for Engineering and th…
Statistics
ISBN:
9781305251809
Author:
Jay L. Devore
Publisher:
Cengage Learning

Statistics for The Behavioral Sciences (MindTap C…
Statistics
ISBN:
9781305504912
Author:
Frederick J Gravetter, Larry B. Wallnau
Publisher:
Cengage Learning
MATLAB: An Introduction with Applications
Statistics
ISBN:
9781119256830
Author:
Amos Gilat
Publisher:
John Wiley & Sons Inc
Probability and Statistics for Engineering and th…
Statistics
ISBN:
9781305251809
Author:
Jay L. Devore
Publisher:
Cengage Learning
Statistics for The Behavioral Sciences (MindTap C…
Statistics
ISBN:
9781305504912
Author:
Frederick J Gravetter, Larry B. Wallnau
Publisher:
Cengage Learning

Elementary Statistics: Picturing the World (7th E…
Statistics
ISBN:
9780134683416
Author:
Ron Larson, Betsy Farber
Publisher:
PEARSON

The Basic Practice of Statistics
Statistics
ISBN:
9781319042578
Author:
David S. Moore, William I. Notz, Michael A. Fligner
Publisher:
W. H. Freeman

Introduction to the Practice of Statistics
Statistics
ISBN:
9781319013387
Author:
David S. Moore, George P. McCabe, Bruce A. Craig
Publisher:
W. H. Freeman