Month Price Jan 2020 $42.28 Mar 2020 $39.49 July 2020 $37.98 Aug 2020 $39.09 Sept 2020 $40.30 Nov 2020 $38.58 Dec 2020 $36.62 a) Create a scatterplot for the data. Scatterplot Sketch: Viewing Window: [ , , 1 [ ,. 1 b) Determine the appropriate type of regression (linear, quadratic, cubic, quartic, other). Why? c) Find the regression model and store it in Y1: (3 decimal places)
Month Price Jan 2020 $42.28 Mar 2020 $39.49 July 2020 $37.98 Aug 2020 $39.09 Sept 2020 $40.30 Nov 2020 $38.58 Dec 2020 $36.62 a) Create a scatterplot for the data. Scatterplot Sketch: Viewing Window: [ , , 1 [ ,. 1 b) Determine the appropriate type of regression (linear, quadratic, cubic, quartic, other). Why? c) Find the regression model and store it in Y1: (3 decimal places)
MATLAB: An Introduction with Applications
6th Edition
ISBN:9781119256830
Author:Amos Gilat
Publisher:Amos Gilat
Chapter1: Starting With Matlab
Section: Chapter Questions
Problem 1P
Related questions
Question
A motorcycle person notice trend in the price of a part he wants to buy from a store. X values = month of 2020. (x=1 would be Jan 2020. Please answer a-e
![Month
Price
Jan 2020
$42.28
Mar 2020
$39.49
July 2020
$37.98
Aug 2020
$39.09
Sept 2020
$40.30
Nov 2020
$38.58
Dec 2020
$36.62
a) Create a scatterplot for the data. Scatterplot Sketch:
Viewing Window: [, , ] [ , , ]
b) Determine the appropriate type of regression (linear, quadratic, cubic, quartic,
other). Why?
c) Find the regression model and store it in Y1:
(3 decimal places)
d) According to the model, what should the price be in February 2021?
e) According to the model, will the price reach $25.00 or less; and in what month
and year will this happen for the first time?](/v2/_next/image?url=https%3A%2F%2Fcontent.bartleby.com%2Fqna-images%2Fquestion%2F7b36ed97-5db4-42c0-9611-29f0b140353d%2F94b8777e-6e2f-43da-b09f-d85cde1bac74%2F8lsbmb_processed.jpeg&w=3840&q=75)
Transcribed Image Text:Month
Price
Jan 2020
$42.28
Mar 2020
$39.49
July 2020
$37.98
Aug 2020
$39.09
Sept 2020
$40.30
Nov 2020
$38.58
Dec 2020
$36.62
a) Create a scatterplot for the data. Scatterplot Sketch:
Viewing Window: [, , ] [ , , ]
b) Determine the appropriate type of regression (linear, quadratic, cubic, quartic,
other). Why?
c) Find the regression model and store it in Y1:
(3 decimal places)
d) According to the model, what should the price be in February 2021?
e) According to the model, will the price reach $25.00 or less; and in what month
and year will this happen for the first time?
Expert Solution
Step 1
“Since you have posted a question with multiple sub-parts, we will solve the first three sub-parts for you. To get the remaining sub-part solved please repost the complete question and mention the sub-parts to be solved.”
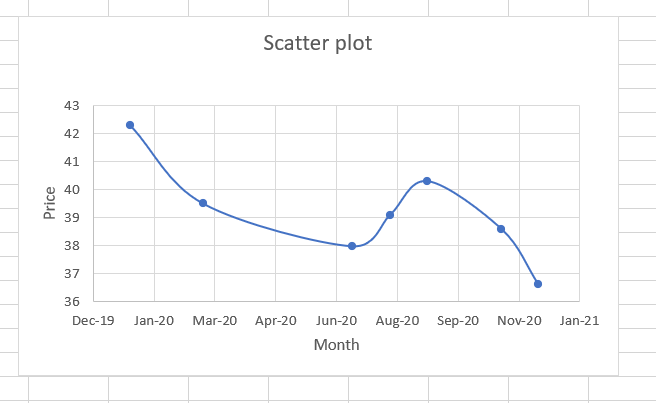
a) Scatter plot for the data,

Step by step
Solved in 2 steps with 2 images

Recommended textbooks for you

MATLAB: An Introduction with Applications
Statistics
ISBN:
9781119256830
Author:
Amos Gilat
Publisher:
John Wiley & Sons Inc

Probability and Statistics for Engineering and th…
Statistics
ISBN:
9781305251809
Author:
Jay L. Devore
Publisher:
Cengage Learning

Statistics for The Behavioral Sciences (MindTap C…
Statistics
ISBN:
9781305504912
Author:
Frederick J Gravetter, Larry B. Wallnau
Publisher:
Cengage Learning

MATLAB: An Introduction with Applications
Statistics
ISBN:
9781119256830
Author:
Amos Gilat
Publisher:
John Wiley & Sons Inc

Probability and Statistics for Engineering and th…
Statistics
ISBN:
9781305251809
Author:
Jay L. Devore
Publisher:
Cengage Learning

Statistics for The Behavioral Sciences (MindTap C…
Statistics
ISBN:
9781305504912
Author:
Frederick J Gravetter, Larry B. Wallnau
Publisher:
Cengage Learning

Elementary Statistics: Picturing the World (7th E…
Statistics
ISBN:
9780134683416
Author:
Ron Larson, Betsy Farber
Publisher:
PEARSON

The Basic Practice of Statistics
Statistics
ISBN:
9781319042578
Author:
David S. Moore, William I. Notz, Michael A. Fligner
Publisher:
W. H. Freeman

Introduction to the Practice of Statistics
Statistics
ISBN:
9781319013387
Author:
David S. Moore, George P. McCabe, Bruce A. Craig
Publisher:
W. H. Freeman