Match the velocity graphs with the motions. 4 The object is moving slowly and steadily. 1. The graph is a horizontal line overlapping the x-axis. 5 The object is moving quickly and steadily. 2. The graph is a horizontal line above x-axis. 2 The object is moving steadily in the positive direction. 3. The graph is a horizontal line below x-axis. 4 The object is at rest. 4. The graph is a horizontal line near x-axis. 3 The object is moving steadily in the negative direction. 5. The graph is a horizontal line away from x-axis.
Match the velocity graphs with the motions. 4 The object is moving slowly and steadily. 1. The graph is a horizontal line overlapping the x-axis. 5 The object is moving quickly and steadily. 2. The graph is a horizontal line above x-axis. 2 The object is moving steadily in the positive direction. 3. The graph is a horizontal line below x-axis. 4 The object is at rest. 4. The graph is a horizontal line near x-axis. 3 The object is moving steadily in the negative direction. 5. The graph is a horizontal line away from x-axis.

Related questions
Question
Please help with the two questions

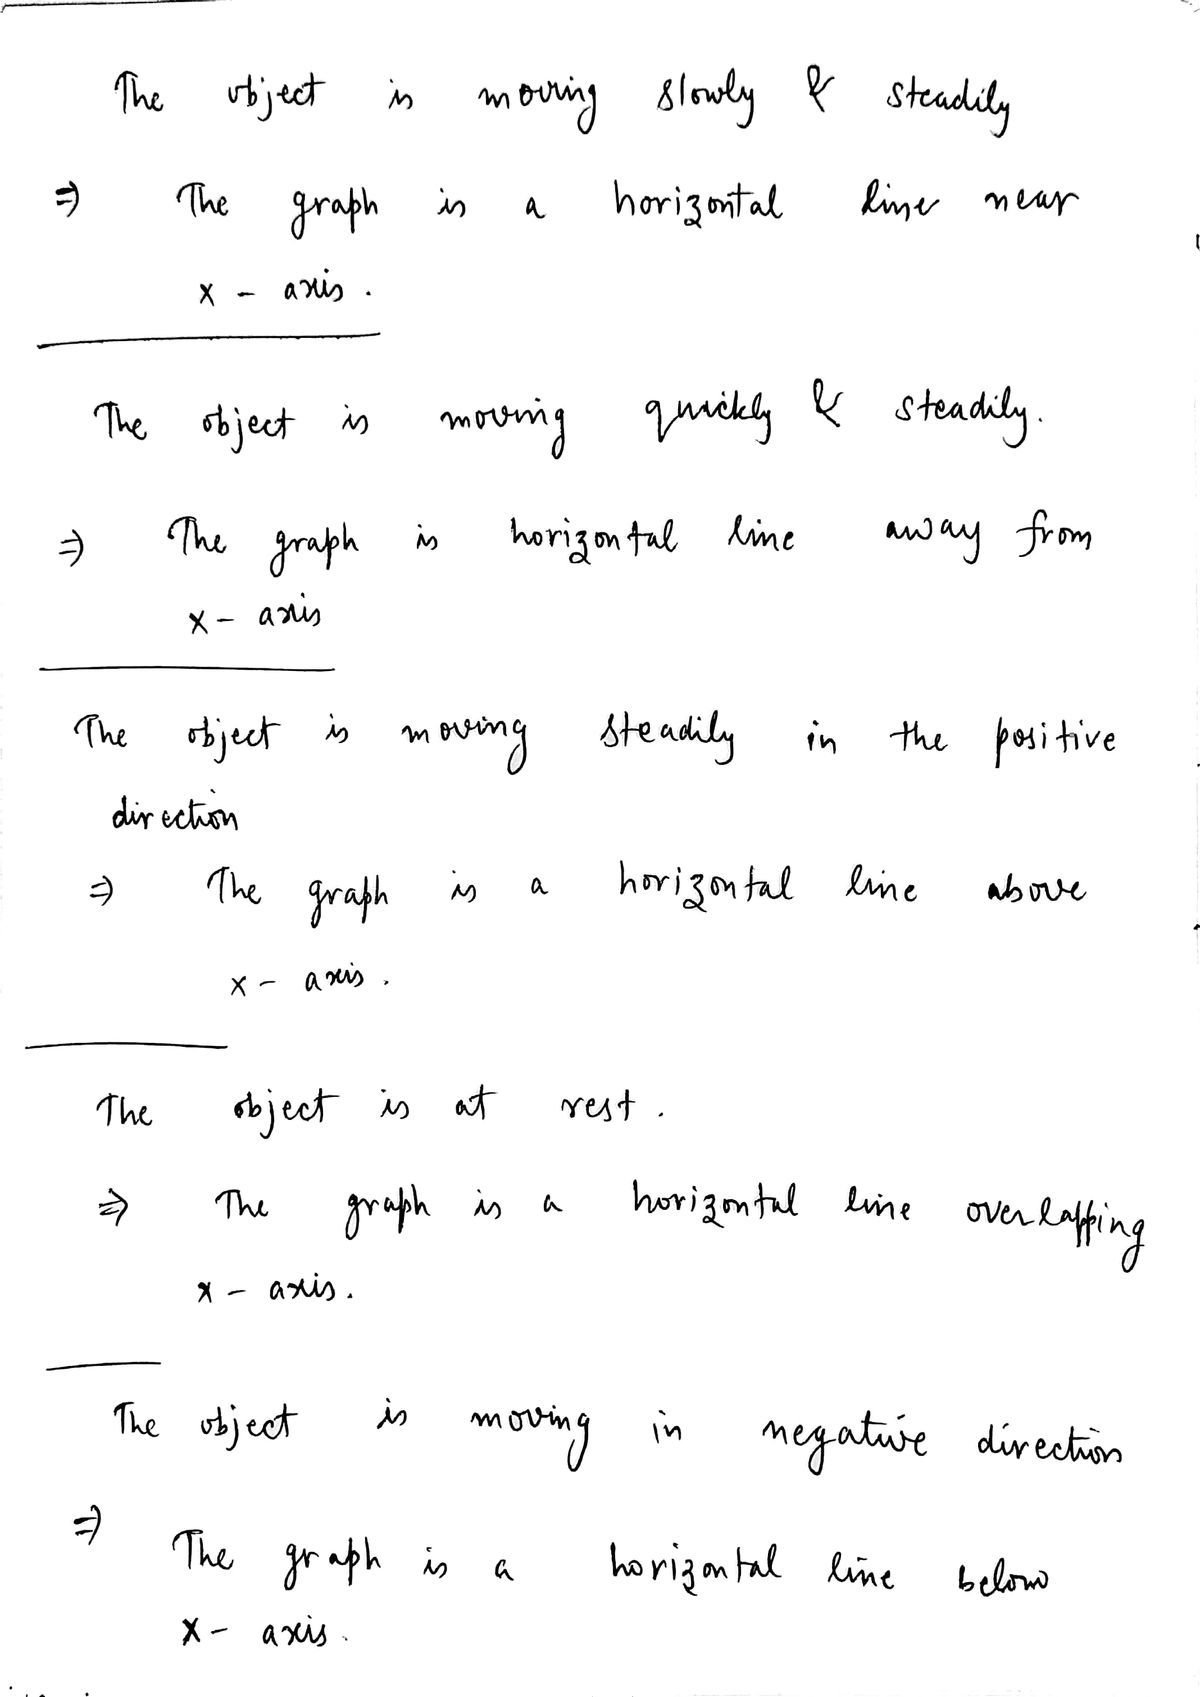
Transcribed Image Text:Match the velocity graphs with the motions.
4 The object is moving slowly and steadily.
1. The graph is a horizontal line overlapping the x-axis.
5
5 The object is moving quickly and steadily.
2. The graph is a horizontal line above x-axis.
_2_
The object is moving steadily in the positive direction.
3. The graph is a horizontal line below x-axis.
4.
The object is at rest.
4. The graph is a horizontal line near x-axis.
3
The object is moving steadily in the negative direction.
5. The graph is a horizontal line away from x-axis.

Transcribed Image Text:22
20
18
16
14
12
A car is traveling along a road as shown in the velocity graph below.
10
2
10
12
14
16
18
20
Time (s)
During which intervals is the car accelerating? Choose all the answers that apply.
between 0 and 3 seconds
between 3 and 8 seconds
between 8 and 13 seconds
between 13 and 17 seconds
between 17 and 20 seconds
Velocity (m/s)
Expert Solution
Step 1
When an object moves with constant velocity then it's velocity time graph is parallel to x axis. If it is moving in positive direction then graph will be above the x axis, if it is moving in negative direction then graph will be below x axis. And if it is at rest then graph will overlap with x axis.

Step by step
Solved in 2 steps with 1 images
