Make a scatter plot. (Carefully choose units on both axes; no need to start at 0, but make them not too small! Do not omit axis labels and the title.) Describe the relationship between Car Weight and MPG. Justify. Give the correlation coefficient to three decimal places. (CV are listed on the last page) Car Weight (pounds), x Miles per Gallon, y A B C D E 2750 2940 3265 3765 4120 25.4 25.1 25.4 19.8 20.2 'f it makes sense, give the equation of the regression line (of MPG on pounds of weight; use at least 3 significant, nonzero, digits) and draw this line on the plot (be precise! use a ruler.) Is the gas mileage (miles per gallon) of the car B above average or below average for cars of the same weight? Justify. What is the best predictor of MPG for a car with weight of 5500 lb. (Be careful!)
Make a scatter plot. (Carefully choose units on both axes; no need to start at 0, but make them not too small! Do not omit axis labels and the title.) Describe the relationship between Car Weight and MPG. Justify. Give the correlation coefficient to three decimal places. (CV are listed on the last page) Car Weight (pounds), x Miles per Gallon, y A B C D E 2750 2940 3265 3765 4120 25.4 25.1 25.4 19.8 20.2 'f it makes sense, give the equation of the regression line (of MPG on pounds of weight; use at least 3 significant, nonzero, digits) and draw this line on the plot (be precise! use a ruler.) Is the gas mileage (miles per gallon) of the car B above average or below average for cars of the same weight? Justify. What is the best predictor of MPG for a car with weight of 5500 lb. (Be careful!)

MATLAB: An Introduction with Applications
6th Edition
ISBN:9781119256830
Author:Amos Gilat
Publisher:Amos Gilat
Chapter1: Starting With Matlab
Section: Chapter Questions
Problem 1P

Related questions
Question
Hi! I need help on the last 3 questions on this problem please!
![**Study on Car Weight and Gas Mileage**
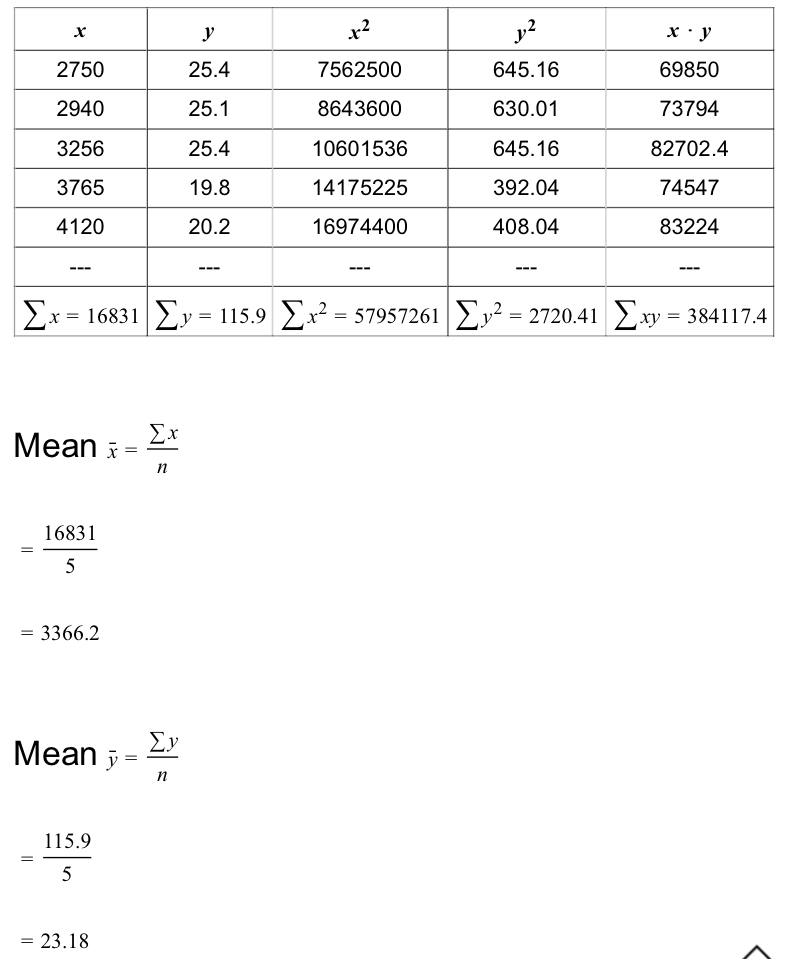
An engineer wants to determine how the weight of a car, \( x \), affects gas mileage, \( y \) (MPG). The following data represent the weights of various cars and their miles per gallon.
\[
\begin{array}{|c|c|c|c|c|c|}
\hline
\text{Car} & A & B & C & D & E \\
\hline
\text{Weight (pounds), } x & 2750 & 2940 & 3265 & 3765 & 4120 \\
\hline
\text{Miles per Gallon, } y & 25.4 & 25.1 & 25.4 & 19.8 & 20.2 \\
\hline
\end{array}
\]
- **Scatter Plot Instructions:**
- Make a scatter plot. Carefully choose units on both axes; no need to start at 0, but make them not too small. Do not omit axis labels and the title.
- **Analyzing the Relationship:**
- Describe the relationship between Car Weight and MPG. **Justify.** Give the correlation coefficient to three decimal places. (CV are listed on the last page).
- **Regression Line Equation:**
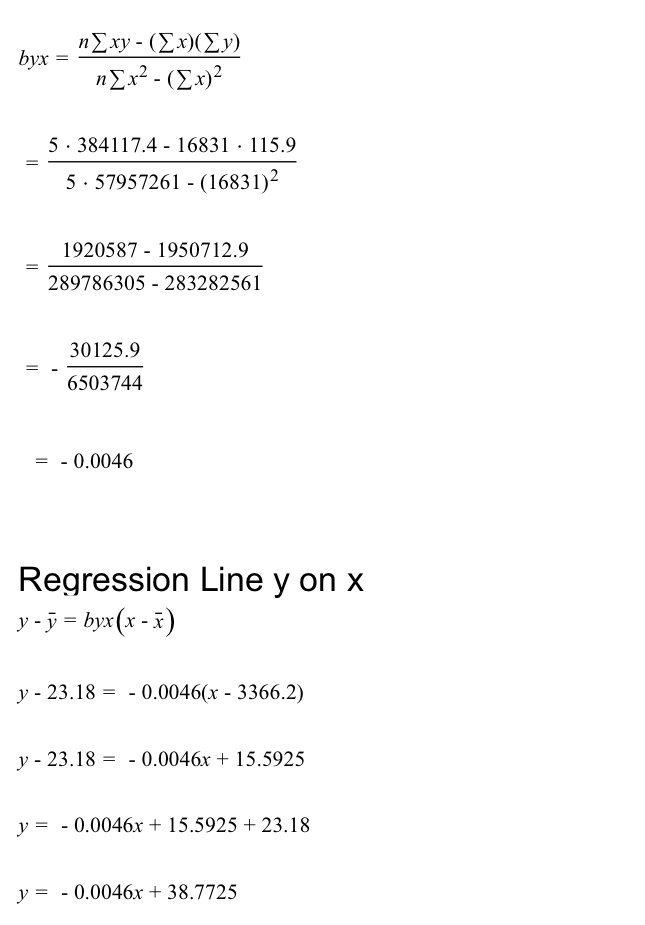
- If it makes sense, give the **equation** of the regression line (of MPG on pounds of weight; use at least 3 significant, nonzero, digits) and **draw** this line on the plot (be precise! use a ruler).
- **Gas Mileage Evaluation:**
- Is the gas mileage (miles per gallon) of the car B above average or below average for cars of the same weight? **Justify.**
- **Prediction for a Specific Weight:**
- What is the best predictor of MPG for a car with a weight of 5500 lb? (Be careful!)
**Graph Description:**
The grid is prepared for plotting the relationship between car weight and MPG. Each square on the grid can represent a unit increment for accurate plotting. Remember, the correlation coefficient and regression line equations require calculations based on the data provided.](/v2/_next/image?url=https%3A%2F%2Fcontent.bartleby.com%2Fqna-images%2Fquestion%2F05240af3-dfc5-417a-b9fb-060aff3e35e9%2F576ccf1d-4a1e-4357-aa58-a5c3a901d140%2Fr94hxgq_processed.jpeg&w=3840&q=75)
Transcribed Image Text:**Study on Car Weight and Gas Mileage**
An engineer wants to determine how the weight of a car, \( x \), affects gas mileage, \( y \) (MPG). The following data represent the weights of various cars and their miles per gallon.
\[
\begin{array}{|c|c|c|c|c|c|}
\hline
\text{Car} & A & B & C & D & E \\
\hline
\text{Weight (pounds), } x & 2750 & 2940 & 3265 & 3765 & 4120 \\
\hline
\text{Miles per Gallon, } y & 25.4 & 25.1 & 25.4 & 19.8 & 20.2 \\
\hline
\end{array}
\]
- **Scatter Plot Instructions:**
- Make a scatter plot. Carefully choose units on both axes; no need to start at 0, but make them not too small. Do not omit axis labels and the title.
- **Analyzing the Relationship:**
- Describe the relationship between Car Weight and MPG. **Justify.** Give the correlation coefficient to three decimal places. (CV are listed on the last page).
- **Regression Line Equation:**
- If it makes sense, give the **equation** of the regression line (of MPG on pounds of weight; use at least 3 significant, nonzero, digits) and **draw** this line on the plot (be precise! use a ruler).
- **Gas Mileage Evaluation:**
- Is the gas mileage (miles per gallon) of the car B above average or below average for cars of the same weight? **Justify.**
- **Prediction for a Specific Weight:**
- What is the best predictor of MPG for a car with a weight of 5500 lb? (Be careful!)
**Graph Description:**
The grid is prepared for plotting the relationship between car weight and MPG. Each square on the grid can represent a unit increment for accurate plotting. Remember, the correlation coefficient and regression line equations require calculations based on the data provided.
Expert Solution
Step 1

Step by step
Solved in 4 steps with 6 images

Recommended textbooks for you
MATLAB: An Introduction with Applications
Statistics
ISBN:
9781119256830
Author:
Amos Gilat
Publisher:
John Wiley & Sons Inc

Probability and Statistics for Engineering and th…
Statistics
ISBN:
9781305251809
Author:
Jay L. Devore
Publisher:
Cengage Learning

Statistics for The Behavioral Sciences (MindTap C…
Statistics
ISBN:
9781305504912
Author:
Frederick J Gravetter, Larry B. Wallnau
Publisher:
Cengage Learning
MATLAB: An Introduction with Applications
Statistics
ISBN:
9781119256830
Author:
Amos Gilat
Publisher:
John Wiley & Sons Inc
Probability and Statistics for Engineering and th…
Statistics
ISBN:
9781305251809
Author:
Jay L. Devore
Publisher:
Cengage Learning
Statistics for The Behavioral Sciences (MindTap C…
Statistics
ISBN:
9781305504912
Author:
Frederick J Gravetter, Larry B. Wallnau
Publisher:
Cengage Learning

Elementary Statistics: Picturing the World (7th E…
Statistics
ISBN:
9780134683416
Author:
Ron Larson, Betsy Farber
Publisher:
PEARSON

The Basic Practice of Statistics
Statistics
ISBN:
9781319042578
Author:
David S. Moore, William I. Notz, Michael A. Fligner
Publisher:
W. H. Freeman

Introduction to the Practice of Statistics
Statistics
ISBN:
9781319013387
Author:
David S. Moore, George P. McCabe, Bruce A. Craig
Publisher:
W. H. Freeman