Listed below are the overhead widths (in cm) of seals moasurod from photographs and the weights (in kg) of the seals. Construct a scafferplot, find the valuc of the linear correlalion coefficient r, and lind the cntical values of r using a =0,05 Is there sufficient evidence to conclude that there is a linear corelation between overhcad widths of seals Irom photographs and the weights of the seals? Overhead Width 74 164 94 200 8.6 7.1 114 97 244 8.2 184 Weight 192 Click here to view a table ol cutical values for the correlation conlicient. Construct a scatterplul. Chonse the correct graph below. OA. Cc. O D. AWight (kg) 300 Awaigh (krj) 300 Aweight (kg) 300 Aweight (kg) 300- 1004 100 100 7. width (cm) 10 100- width (am) 10 width (em 10 Midth (cm
Please answer all steps to this question. A - E

The scatter plot can be obtained using EXCEL software.
- Enter the values of X in column A and Y in column B.
- Select the range of two variables with labels.
- Go to Insert > Charts > Scatter plo
- Click OK.
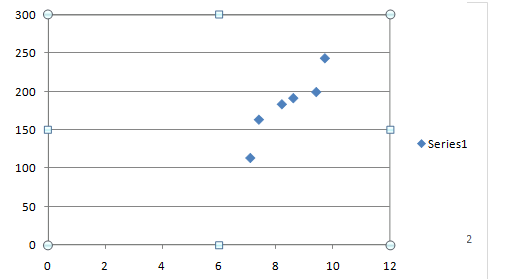
The scatter diagram for the data is as follows:

The minimum value of weight is 114. Based on the above graph, the correct scatter plot is option D.
Correlation coefficient r:
The hypotheses are given below:
Null hypothesis:
H0: r = 0
That is, there is no linear correlation between the overhead width of photographs and the weight of the seals.
Alternative hypothesis:
Ha: r≠ 0
That is, there is a linear correlation between the overhead width of photographs and the weight of the seals.
Degrees of freedom:
The formula for degrees of freedom is as follows:
Df = n – 2.
The number of data values given are 6, that is n = 6
Substitute n = 6 in the degrees of freedom formula.
Df = n – 2 = 6 – 2 = 4.
The level of significance for the test is 0.05.
Sample correlation coefficient:
The value of the sample correlation coefficient (r) can be obtained using Excel formula.
Enter the values of overhead width in columns A1:A6 in Excel.
Enter the values of weight of the seals in columns B1:B6 in Excel.
Enter the function, =CORREL (A1:A6,B1:B6).
Thus, the value of the sample correlation coefficient, r is 0.9211.
Test Statistic:
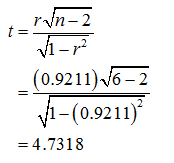
The test statistic for hypothesis test is calculated as follows:

Trending now
This is a popular solution!
Step by step
Solved in 5 steps with 3 images


