Listed below are the overhead widths (in cm) of seals measured from photographs and the weights (in kg) of the seals. Construct a scatterplot, find the value of the linear correlation coefficient r, and find the critical values of r using a = 0.01. Is there sufficient evidence to conclude that there is a linear correlation between overhead widths of seals from photographs and the weights of the seals? Overhead Width 7.1 7.6 159 9.8 9.3 8.7 8.1 Weight 112 245 198 200 180 Click here to view a table of critical values for the correlation coefficient. -... Construct a scatterplot. Choose the correct graph below. OA. OB. OC. OD. Aweight (kg) 300- Aweight (kg) 300- Aweight (kg) 300- Aweight (kg) 300- ... - ... .. 100- 7 100+ 100- 7 100- 10 10 10 10 width (cm) width (cm) width (cm) width (cm)
Listed below are the overhead widths (in cm) of seals measured from photographs and the weights (in kg) of the seals. Construct a scatterplot, find the value of the linear correlation coefficient r, and find the critical values of r using a = 0.01. Is there sufficient evidence to conclude that there is a linear correlation between overhead widths of seals from photographs and the weights of the seals? Overhead Width 7.1 7.6 159 9.8 9.3 8.7 8.1 Weight 112 245 198 200 180 Click here to view a table of critical values for the correlation coefficient. -... Construct a scatterplot. Choose the correct graph below. OA. OB. OC. OD. Aweight (kg) 300- Aweight (kg) 300- Aweight (kg) 300- Aweight (kg) 300- ... - ... .. 100- 7 100+ 100- 7 100- 10 10 10 10 width (cm) width (cm) width (cm) width (cm)

MATLAB: An Introduction with Applications
6th Edition
ISBN:9781119256830
Author:Amos Gilat
Publisher:Amos Gilat
Chapter1: Starting With Matlab
Section: Chapter Questions
Problem 1P

Related questions
Question
100%
3- Hi Wonderful Bartleby Team (Thanks for all the help I do really aprecciate all you guys do)
I need help with this stats exercise, it has 4 parts so please provide the answer for all of them since each point counts in order to get full credict for it. The last part which is a sentence has the options of
-Because the P-value of the linear

Transcribed Image Text:The linear correlation coefficient is r=
(Round to three decimal places as needed.)
The critical values are r=
(Round to three decimal places as needed. Use
comma to separate answers as needed.)
Because the absolute value of the linear correlation coefficient is
than the positive critical value, there
V sufficient evidence to support the claim that there is a linear
correlation between overhead widths of seals from photographs and the weights of the seals for a significance level of a = 0.01.

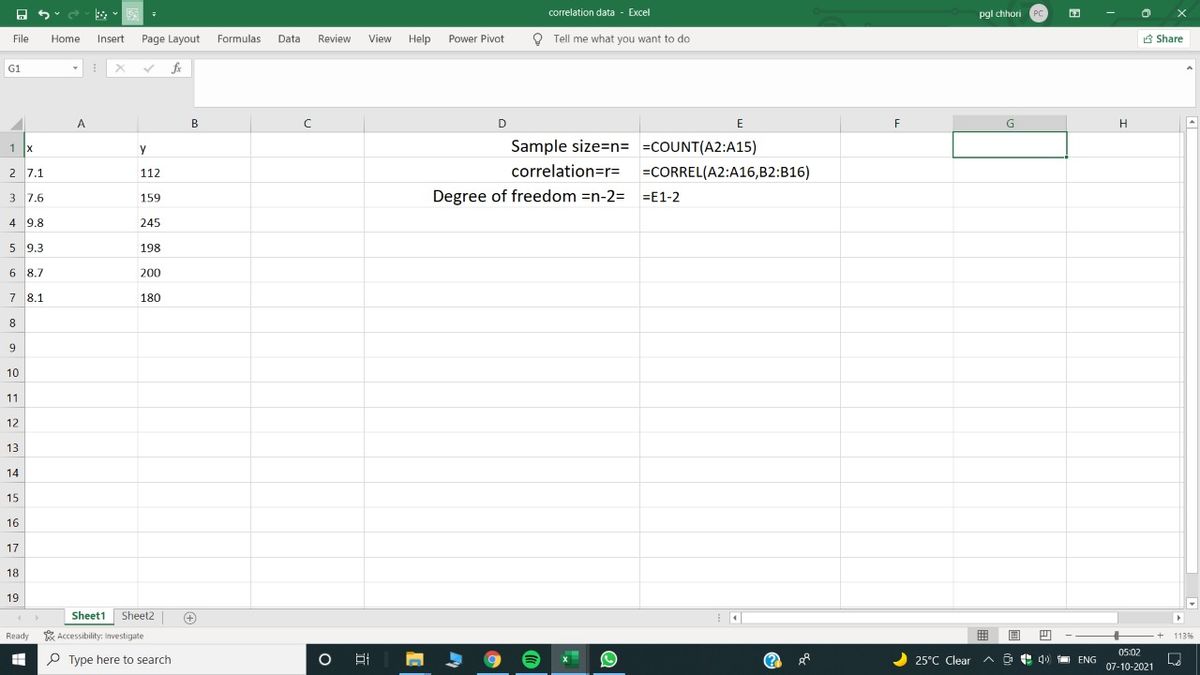
Transcribed Image Text:Listed below are the overhead widths (in cm) of seals measured from photographs and the weights (in kg) of the seals. Construct a scatterplot, find the value of the linear correlation
coefficient r, and find the critical values of r using a = 0.01. Is there sufficient evidence to conclude that there is a linear correlation between overhead widths of seals from photographs
and the weights of the seals?
Overhead Width
7.1
7.6
9.8
245
9.3
8.7
8.1
Weight
112
159
198
200
180
Click here to view a table of critical values for the correlation coefficient.
-....
Construct a scatterplot. Choose the correct graph below.
OA.
OB.
OC.
OD.
OD.
Aweight (kg)
300-
Aweight (kg)
300-
Aweight (kg)
300-
Aweight (kg)
300-
... -
...
100-
7
100+
100+
7
100-
10
10
10
10
width (cm)
width (cm)
width (cm)
width (cm)
Expert Solution
Step 1
Solution

Step by step
Solved in 2 steps with 2 images

Recommended textbooks for you
MATLAB: An Introduction with Applications
Statistics
ISBN:
9781119256830
Author:
Amos Gilat
Publisher:
John Wiley & Sons Inc

Probability and Statistics for Engineering and th…
Statistics
ISBN:
9781305251809
Author:
Jay L. Devore
Publisher:
Cengage Learning

Statistics for The Behavioral Sciences (MindTap C…
Statistics
ISBN:
9781305504912
Author:
Frederick J Gravetter, Larry B. Wallnau
Publisher:
Cengage Learning
MATLAB: An Introduction with Applications
Statistics
ISBN:
9781119256830
Author:
Amos Gilat
Publisher:
John Wiley & Sons Inc
Probability and Statistics for Engineering and th…
Statistics
ISBN:
9781305251809
Author:
Jay L. Devore
Publisher:
Cengage Learning
Statistics for The Behavioral Sciences (MindTap C…
Statistics
ISBN:
9781305504912
Author:
Frederick J Gravetter, Larry B. Wallnau
Publisher:
Cengage Learning

Elementary Statistics: Picturing the World (7th E…
Statistics
ISBN:
9780134683416
Author:
Ron Larson, Betsy Farber
Publisher:
PEARSON

The Basic Practice of Statistics
Statistics
ISBN:
9781319042578
Author:
David S. Moore, William I. Notz, Michael A. Fligner
Publisher:
W. H. Freeman

Introduction to the Practice of Statistics
Statistics
ISBN:
9781319013387
Author:
David S. Moore, George P. McCabe, Bruce A. Craig
Publisher:
W. H. Freeman