Glencoe Algebra 1, Student Edition, 9780079039897, 0079039898, 2018
18th Edition
ISBN:9780079039897
Author:Carter
Publisher:Carter
Chapter3: Linear And Nonlinear Functions
Section: Chapter Questions
Problem 26MCQ
Related questions
Question

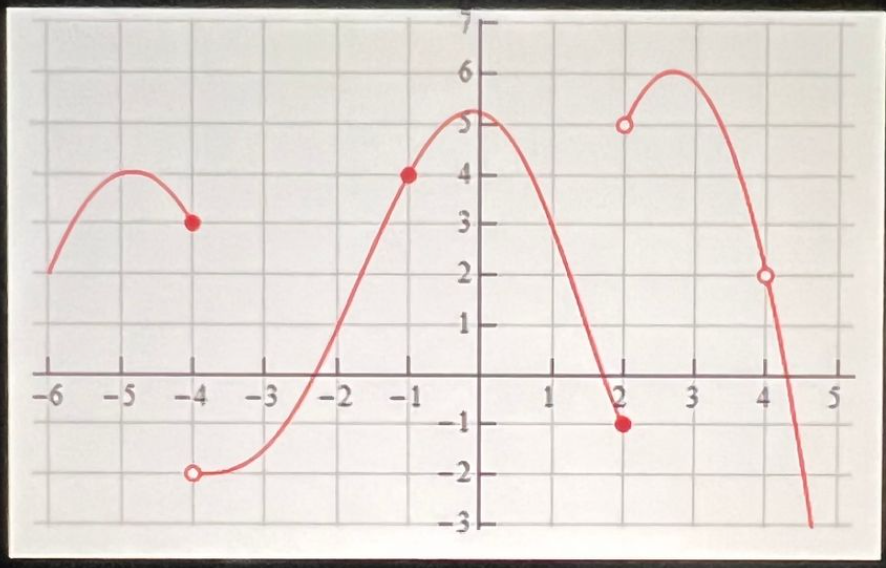
Transcribed Image Text:The image presents the problem:
"Let \( y = f(x) \) be given by the graph below:"
It includes a graph on a Cartesian plane, with a red curve representing the function \( f(x) \). Several points along the graph are highlighted, indicating key features:
- The curve begins from the left, initially increasing, reaches a peak at approximately \((-5, 1)\), and then decreases.
- There is a notable point at \((-4, 1)\), which the curve passes through.
- A hole is present on the curve at \((-4, 1)\), indicating a discontinuity at this point.
- The curve decreases to a minimum around \((-3, -1.5)\) and then increases again to a local maximum roughly at \((0, 6)\).
- The graph then decreases, passing through \((1, 0)\) and continuing in a downward trend.
- At \(x = 2\), a point is marked at \((2, -1)\), signifying another critical point on the curve.
- From \(x = 2\), the curve increases to a peak before declining off the frame, with a hole visible at approximately \((3, 5)\).
The task at the bottom of the image is to:
"Determine the exact value of \(\lim_{x \to -4^+} f(x)\)."
The graph suggests examining the right-hand limit as \(x\) approaches \(-4\) from the positive side, which visually approaches the value around \( \(-1\) on the graph.
Expert Solution
Step 1: Consider the given graph
Consider the graph of given below

Step by step
Solved in 3 steps with 4 images

Recommended textbooks for you

Glencoe Algebra 1, Student Edition, 9780079039897…
Algebra
ISBN:
9780079039897
Author:
Carter
Publisher:
McGraw Hill

Glencoe Algebra 1, Student Edition, 9780079039897…
Algebra
ISBN:
9780079039897
Author:
Carter
Publisher:
McGraw Hill