Let X Fm,n. Show that Fa;m, n questions. = F1-ain,m and ti-n = F1-a;1,n and draw the relevant graphs for both
Let X Fm,n. Show that Fa;m, n questions. = F1-ain,m and ti-n = F1-a;1,n and draw the relevant graphs for both

MATLAB: An Introduction with Applications
6th Edition
ISBN:9781119256830
Author:Amos Gilat
Publisher:Amos Gilat
Chapter1: Starting With Matlab
Section: Chapter Questions
Problem 1P

Related questions
Question
![**Given:**
Let \( X \sim F_{m,n} \).
**Task:**
1. Show that
\[
F_{\alpha; m,n} = \frac{1}{F_{1-\alpha; n,m}}
\]
2. Show that
\[
t^2_{1-\frac{\alpha}{2}; n} = F_{1-\alpha; 1,n}
\]
**Additionally:** Draw the relevant graphs for both questions.
**Explanation:**
The task involves proving mathematical relationships between F-distributions and T-distributions, and then illustrating these concepts with appropriate graphs. The given equations are related to statistical distributions and involve probability and critical values.
For graphs, consider visualizing the properties of F-distributions and T-distributions. These graphs might show probability density functions (PDFs) highlighting critical values (\( F_{\alpha} \), \( t_{1-\frac{\alpha}{2}} \)) and their relationships.](/v2/_next/image?url=https%3A%2F%2Fcontent.bartleby.com%2Fqna-images%2Fquestion%2F1dcb123b-294f-4e69-8c13-99ba0a677569%2F1c57174e-b629-4e66-b270-3f2df88642b5%2F0jkgr4t_processed.png&w=3840&q=75)
Transcribed Image Text:**Given:**
Let \( X \sim F_{m,n} \).
**Task:**
1. Show that
\[
F_{\alpha; m,n} = \frac{1}{F_{1-\alpha; n,m}}
\]
2. Show that
\[
t^2_{1-\frac{\alpha}{2}; n} = F_{1-\alpha; 1,n}
\]
**Additionally:** Draw the relevant graphs for both questions.
**Explanation:**
The task involves proving mathematical relationships between F-distributions and T-distributions, and then illustrating these concepts with appropriate graphs. The given equations are related to statistical distributions and involve probability and critical values.
For graphs, consider visualizing the properties of F-distributions and T-distributions. These graphs might show probability density functions (PDFs) highlighting critical values (\( F_{\alpha} \), \( t_{1-\frac{\alpha}{2}} \)) and their relationships.
Expert Solution
Step 1: we define the given information first the we show that one by one
Given,
format('truetype')%3Bfont-weight%3Anormal%3Bfont-style%3Anormal%3B%7D%3C%2Fstyle%3E%3C%2Fdefs%3E%3Ctext%20font-family%3D%22Arial%22%20font-size%3D%2216%22%20font-style%3D%22italic%22%20text-anchor%3D%22middle%22%20x%3D%225.5%22%20y%3D%2216%22%3EX%3C%2Ftext%3E%3Ctext%20font-family%3D%22math1d5a744be5825ca5bd6c2e20d0f%22%20font-size%3D%2216%22%20text-anchor%3D%22middle%22%20x%3D%2220.5%22%20y%3D%2216%22%3E%26%23x223C%3B%3C%2Ftext%3E%3Ctext%20font-family%3D%22Arial%22%20font-size%3D%2216%22%20font-style%3D%22italic%22%20text-anchor%3D%22middle%22%20x%3D%2234.5%22%20y%3D%2216%22%3EF%3C%2Ftext%3E%3Ctext%20font-family%3D%22Arial%22%20font-size%3D%2212%22%20font-style%3D%22italic%22%20text-anchor%3D%22middle%22%20x%3D%2245.5%22%20y%3D%2222%22%3Em%3C%2Ftext%3E%3Ctext%20font-family%3D%22math1d5a744be5825ca5bd6c2e20d0f%22%20font-size%3D%2212%22%20text-anchor%3D%22middle%22%20x%3D%2253.5%22%20y%3D%2222%22%3E%2C%3C%2Ftext%3E%3Ctext%20font-family%3D%22Arial%22%20font-size%3D%2212%22%20font-style%3D%22italic%22%20text-anchor%3D%22middle%22%20x%3D%2258.5%22%20y%3D%2222%22%3En%3C%2Ftext%3E%3C%2Fsvg%3E)
%3C%2Fmo%3E%3Cmo%3E%3D%3C%2Fmo%3E%3Cmfrac%3E%3Cmfenced%20close%3D%22%5D%22%20open%3D%22%5B%22%3E%3Cmstyle%20displaystyle%3D%22true%22%3E%3Cmfrac%3E%3Cmi%3Em%3C%2Fmi%3E%3Cmi%3En%3C%2Fmi%3E%3C%2Fmfrac%3E%3C%2Fmstyle%3E%3C%2Fmfenced%3E%3Cmrow%3E%3Cmi%3EB%3C%2Fmi%3E%3Cmfenced%3E%3Cmstyle%20displaystyle%3D%22true%22%3E%3Cmfrac%3E%3Cmi%3Em%3C%2Fmi%3E%3Cmn%3E2%3C%2Fmn%3E%3C%2Fmfrac%3E%3Cmo%3E%2C%3C%2Fmo%3E%3Cmfrac%3E%3Cmi%3En%3C%2Fmi%3E%3Cmn%3E2%3C%2Fmn%3E%3C%2Fmfrac%3E%3C%2Fmstyle%3E%3C%2Fmfenced%3E%3C%2Fmrow%3E%3C%2Fmfrac%3E%3Cmfrac%3E%3Cmsup%3E%3Cmfenced%20close%3D%22%5D%22%20open%3D%22%5B%22%3E%3Cmstyle%20displaystyle%3D%22true%22%3E%3Cmfrac%3E%3Cmi%3Em%3C%2Fmi%3E%3Cmi%3En%3C%2Fmi%3E%3C%2Fmfrac%3E%3Cmi%3EF%3C%2Fmi%3E%3C%2Fmstyle%3E%3C%2Fmfenced%3E%3Cmstyle%20displaystyle%3D%22true%22%3E%3Cmfrac%3E%3Cmi%3Em%3C%2Fmi%3E%3Cmn%3E2%3C%2Fmn%3E%3C%2Fmfrac%3E%3Cmo%3E-%3C%2Fmo%3E%3Cmn%3E1%3C%2Fmn%3E%3C%2Fmstyle%3E%3C%2Fmsup%3E%3Cmsup%3E%3Cmfenced%20close%3D%22%5D%22%20open%3D%22%5B%22%3E%3Cmrow%3E%3Cmn%3E1%3C%2Fmn%3E%3Cmo%3E%2B%3C%2Fmo%3E%3Cmfrac%3E%3Cmi%3Em%3C%2Fmi%3E%3Cmi%3En%3C%2Fmi%3E%3C%2Fmfrac%3E%3Cmi%3EF%3C%2Fmi%3E%3C%2Fmrow%3E%3C%2Fmfenced%3E%3Cmstyle%20displaystyle%3D%22true%22%3E%3Cmfrac%3E%3Cmrow%3E%3Cmi%3Em%3C%2Fmi%3E%3Cmo%3E%2B%3C%2Fmo%3E%3Cmi%3En%3C%2Fmi%3E%3C%2Fmrow%3E%3Cmn%3E2%3C%2Fmn%3E%3C%2Fmfrac%3E%3C%2Fmstyle%3E%3C%2Fmsup%3E%3C%2Fmfrac%3E%3Cmo%3E%26%23xA0%3B%3C%2Fmo%3E%3Cmo%3E%26%23xA0%3B%3C%2Fmo%3E%3Cmo%3E%2C%3C%2Fmo%3E%3Cmn%3E0%3C%2Fmn%3E%3Cmo%3E%26%23x2264%3B%3C%2Fmo%3E%3Cmi%3EF%3C%2Fmi%3E%3Cmo%3E%26%23x2264%3B%3C%2Fmo%3E%3Cmo%3E%26%23x221E%3B%3C%2Fmo%3E%3C%2Fmath%3E--%3E%3Cdefs%3E%3Cstyle%20type%3D%22text%2Fcss%22%3E%40font-face%7Bfont-family%3A'aec8956637a99787bd197eacd77acce'%3Bsrc%3Aurl(data%3Afont%2Ftruetype%3Bcharset%3Dutf-8%3Bbase64%2CAAEAAAAMAIAAAwBAT1MvMjv%2FLJYAAADMAAAATmNtYXDgWxEdAAABHAAAADRjdnQgAAAABwAAAVAAAAAEZ2x5ZoYrxVAAAAFUAAAAsmhlYWQOdyayAAACCAAAADZoaGVhC0UVwQAAAkAAAAAkaG10eCg8AIUAAAJkAAAACGxvY2EAAAVKAAACbAAAAAxtYXhwBIoEWwAAAngAAAAgbmFtZXSF9ZsAAAKYAAABrXBvc3QDogHPAAAESAAAACBwcmVwukanGAAABGgAAAANAAAGtAGQAAUAAAgACAAAAAAACAAIAAAAAAAAAQIAAAAAAAAAAAAAAAAAAAAAAAAAAAAAAAAAAAAAACAgICAAAAAg8AMGe%2F57AAAHPgGyAAAAAAACAAEAAQAAABQAAwABAAAAFAAEACAAAAAEAAQAAQAAAGb%2F%2FwAAAGb%2F%2F%2F%2BbAAEAAAAAAAAABwACAFUAAAMAA6sAAwAHAAAzESERJSERIVUCq%2F2rAgD%2BAAOr%2FFVVAwAAAQAB%2FvUC9QZDABoANRgBsBsQsAjUsAgQsAHUsBsQsAzUsAwQsBjUALAbELAK1LAKELAL1LAbELAA1LAAELAY1DAxAREQIyInNRY3ESM3FzUQITIXFSYjIgYdASEVAWXfWSyxAYYDgwFkWYVZWVmFAQsDp%2FxZ%2FvUshlmyA6eHAYUBkVmGWVmyhYYAAAABAAAAAQAAmr%2FbrF8PPPUAAwgA%2F%2F%2F%2F%2F9Wt7j3%2F%2F%2F%2F%2F1a3uPQAB%2FvUEAwZDAAAACgACAAEAAAAAAAEAAAc%2B%2Fk4AABdwAAH%2F%2FAQDAAEAAAAAAAAAAAAAAAAAAAACA1IAVQLxAAEAAAAAAAAAKAAAALIAAQAAAAIAHgADAAAAAAACAIAEAAAAAAAEAAA7AAAAAAAAABUBAgAAAAAAAAABABYAAAAAAAAAAAACAA4AFgAAAAAAAAADADQAJAAAAAAAAAAEABYAWAAAAAAAAAAFABYAbgAAAAAAAAAGAAsAhAAAAAAAAAAIABwAjwABAAAAAAABABYAAAABAAAAAAACAA4AFgABAAAAAAADADQAJAABAAAAAAAEABYAWAABAAAAAAAFABYAbgABAAAAAAAGAAsAhAABAAAAAAAIABwAjwADAAEECQABABYAAAADAAEECQACAA4AFgADAAEECQADADQAJAADAAEECQAEABYAWAADAAEECQAFABYAbgADAAEECQAGAAsAhAADAAEECQAIABwAjwBNAGEAdABoACAARgBvAG4AdAAgADIAUgBlAGcAdQBsAGEAcgBNAGEAdABoAHMAIABGAG8AcgAgAE0AbwByAGUAIABNAGEAdABoACAARgBvAG4AdAAgADIATQBhAHQAaAAgAEYAbwBuAHQAIAAyAFYAZQByAHMAaQBvAG4AIAAxAC4AME1hdGhfRm9udF8yAE0AYQB0AGgAcwAgAEYAbwByACAATQBvAHIAZQAAAAADAAAAAAAAA58BzwAAAAAAAAAAAAAAAAAAAAAAAAAAuQciAACNhRgAsgAAAAAAAA%3D%3D)format('truetype')%3Bfont-weight%3Anormal%3Bfont-style%3Anormal%3B%7D%40font-face%7Bfont-family%3A'math1208fbb20a771f2e9bb368f9212'%3Bsrc%3Aurl(data%3Afont%2Ftruetype%3Bcharset%3Dutf-8%3Bbase64%2CAAEAAAAMAIAAAwBAT1MvMi7iBBMAAADMAAAATmNtYXDEvmKUAAABHAAAAFxjdnQgDVUNBwAAAXgAAAA6Z2x5ZoPi2VsAAAG0AAAC0GhlYWQQC2qxAAAEhAAAADZoaGVhCGsXSAAABLwAAAAkaG10eE2rRkcAAATgAAAAHGxvY2EAHTwYAAAE%2FAAAACBtYXhwBT0FPgAABRwAAAAgbmFtZaBxlY4AAAU8AAABn3Bvc3QB9wD6AAAG3AAAACBwcmVwa1uragAABvwAAAAUAAADSwGQAAUAAAQABAAAAAAABAAEAAAAAAAAAQEAAAAAAAAAAAAAAAAAAAAAAAAAAAAAAAAAAAAAACAgICAAAAAg1UADev96AAAD6ACWAAAAAAACAAEAAQAAABQAAwABAAAAFAAEAEgAAAAOAAgAAgAGACsALAA9IhIiHiJk%2F%2F8AAAArACwAPSISIh4iZP%2F%2F%2F9b%2F1v%2FG3fLd592iAAEAAAAAAAAAAAAAAAAAAAAAAVQDLACAAQAAVgAqAlgCHgEOASwCLABaAYACgACgANQAgAAAAAAAAAArAFUAgACrANUBAAErAAcAAAACAFUAAAMAA6sAAwAHAAAzESERJSERIVUCq%2F2rAgD%2BAAOr%2FFVVAwAAAQCAAFUC1QKrAAsASQEYsgwBARQTELEAA%2FaxAQT1sAo8sQMF9bAIPLEFBPWwBjyxDQPmALEAABMQsQEG5LEBARMQsAU8sQME5bELBfWwBzyxCQTlMTATIREzESEVIREjESGAAQBVAQD%2FAFX%2FAAGrAQD%2FAFb%2FAAEAAAEAVf9kANUAgAAKAAAzNTMVFAYHJz4BN1WALy8bHh4BgHo9URQpDjQxAAIAgADrAtUCFQADAAcAZRgBsAgQsAbUsAYQsAXUsAgQsAHUsAEQsADUsAYQsAc8sAUQsAQ8sAEQsAI8sAAQsAM8ALAIELAG1LAGELAH1LAHELAB1LABELAC1LAGELAFPLAHELAEPLABELAAPLACELADPDEwEyE1IR0BITWAAlX9qwJVAcBV1VVVAAEAgAFVAtUBqwADADAYAbAEELEAA%2FawAzyxAgf1sAE8sQUD5gCxAAATELEABuWxAAETELABPLEDBfWwAjwTIRUhgAJV%2FasBq1YAAwAAAIQD0AI8ACMAMwBDAAABNjc2MzIXFhUUBwYjIicmJyYnBgcGIyInJjU0NzYzMhcWFxYXFhcWMzI3NjU0JyYjIgcGByYnJiMiBwYVFBcWMzI3NgH3R2MsLmQ%2FMkU9WXxaEQ0GIUdkLC5kPzJFPVl8WhANB0lWKDc7TDEjPS47dF0Od1YoNztMMSM9Ljt0XQ0BrF4iEE89UF9DOkkMEAYlXSMQTz1QX0M6SA4OBlZkICs4KDRPNSdwDkplHyw4KDVPNChwDgADAID%2FqwKAAqsAAwAHAAsALxgBALEJAD%2BxCAXksQIF9LEBBPSxBgX0sQME5LEFBPSxBAX0sQcBEDyxAAYQPDAxEwcBNRM1ARcBNSEVgQEB%2FwH%2BAAEB%2F%2F4AAatW%2FwBWAapW%2FwBW%2FlZVVQABAAAAAQAA1XjOQV8PPPUAAwQA%2F%2F%2F%2F%2F9Y6E3P%2F%2F%2F%2F%2F1joTcwAA%2FyAEgAOrAAAACgACAAEAAAAAAAEAAAPo%2F2oAABdwAAD%2FtgSAAAEAAAAAAAAAAAAAAAAAAAAHA1IAVQNWAIABMwBVA1YAgANWAIADwAAAAwAAgAAAAAAAAAAoAAAAoQAAAMsAAAFVAAABnwAAAmcAAALQAAEAAAAHAF4ABQAAAAAAAgCABAAAAAAABAAA3gAAAAAAAAAVAQIAAAAAAAAAAQASAAAAAAAAAAAAAgAOABIAAAAAAAAAAwAwACAAAAAAAAAABAASAFAAAAAAAAAABQAWAGIAAAAAAAAABgAJAHgAAAAAAAAACAAcAIEAAQAAAAAAAQASAAAAAQAAAAAAAgAOABIAAQAAAAAAAwAwACAAAQAAAAAABAASAFAAAQAAAAAABQAWAGIAAQAAAAAABgAJAHgAAQAAAAAACAAcAIEAAwABBAkAAQASAAAAAwABBAkAAgAOABIAAwABBAkAAwAwACAAAwABBAkABAASAFAAAwABBAkABQAWAGIAAwABBAkABgAJAHgAAwABBAkACAAcAIEATQBhAHQAaAAgAEYAbwBuAHQAUgBlAGcAdQBsAGEAcgBNAGEAdABoAHMAIABGAG8AcgAgAE0AbwByAGUAIABNAGEAdABoACAARgBvAG4AdABNAGEAdABoACAARgBvAG4AdABWAGUAcgBzAGkAbwBuACAAMQAuADBNYXRoX0ZvbnQATQBhAHQAaABzACAARgBvAHIAIABNAG8AcgBlAAADAAAAAAAAAfQA%2BgAAAAAAAAAAAAAAAAAAAAAAAAAAuQcRAACNhRgAsgAAABUUE7EAAT8%3D)format('truetype')%3Bfont-weight%3Anormal%3Bfont-style%3Anormal%3B%7D%40font-face%7Bfont-family%3A'brack_sme7112986b8ab9304894f510'%3Bsrc%3Aurl(data%3Afont%2Ftruetype%3Bcharset%3Dutf-8%3Bbase64%2CAAEAAAAMAIAAAwBAT1MvMi7PH4UAAADMAAAATmNtYXA3kjw6AAABHAAAAGxjdnQgAQYDiAAAAYgAAAASZ2x5ZkyYQ7YAAAGcAAACGmhlYWQLyR8fAAADuAAAADZoaGVhAq0XCAAAA%2FAAAAAkaG10eDEjA%2FUAAAQUAAAAJGxvY2EAAEKZAAAEOAAAAChtYXhwBJsEcQAABGAAAAAgbmFtZW7QvZAAAASAAAAB5XBvc3QArQBVAAAGaAAAACBwcmVwu5WEAAAABogAAAAHAAACDAGQAAUAAAQABAAAAAAABAAEAAAAAAAAAQEAAAAAAAAAAAAAAAAAAAAAAAAAAAAAAAAAAAAAACAgICAAAAAg9AMD%2FP%2F8AAABVAABAAAAAAACAAEAAQAAABQAAwABAAAAFAAEAFgAAAASABAAAwACI5wjnyOhI6IjoyOkI6Ujpv%2F%2FAAAjnCOfI6EjoiOjI6QjpSOm%2F%2F%2FcZdxj3GLcYtxi3GLcYtxiAAEAAAAAAAAAAAAAAAAAAAAAAAAAAAFUAFQBAAArAIwAgACoAAcAAAACAAAAAADVAQEAAwAHAAAxMxEjFyM1M9XVq4CAAQHWqwABAAAAAABVAVgAAwAfGAGwAy%2BwADyxAgL1sAE8ALEDAD%2BwAjx8sQAG9bABPBEzESNVVQFY%2FqgAAQDXAAABLAFUAAMAIBgBsAUvsAE8sAI8sQAC9bADPACwAy%2BwAjyxAAH1sAE8EzMRI9dVVQFU%2FqwAAQAAAAABAAFUAAUAKRgBsAYQsADUsAAQsAXUsAUQsAPUALAGELAA1LAAELAD1LADELAB1DAxMREhFSMVAQCrAVRV%2FwABAAAAAABVAVQAAwAhGAGwAS%2BxBwI8PLEDAvWwADwAsQMAP7ACPHyxAAb1sAE8ETMRI1VVAVT%2BrAABAAAAAAEAAVQABQApGAGwBhCwANSwABCwBdSwBRCwA9QAsAYQsADUsAAQsAPUsAMQsAHUMDEZASE1IzUBAKsBVP6sVf8AAQAAAAABAAFUAAUAKRgBsAYQsAHUsAEQsADUsAAQsATUALAGELAB1LABELAE1LAEELAC1DAxOwERIRUzq1X%2FAKsBVFUAAQCqAAABAAFUAAMAIRgBsAEvsQcCPDyxAwL1sAA8ALEDAD%2BwAjx8sQAG9bABPBMzESOqVlYBVP6sAAEAAAAAAQABVAAFACkYAbAGELAB1LABELAA1LAAELAE1ACwBhCwAdSwARCwBNSwBBCwAtQwMRMzESE1M6tV%2FwCrAVT%2BrFUAAAABAAAAAQAAix6x7F8PPPUAAwQA%2F%2F%2F%2F%2F9Wt7mT%2F%2F%2F%2F%2F1a3uZP%2BA%2F%2F8B1gFYAAAACgACAAEAAAAAAAEAAAFU%2F%2F8AABdw%2F4D%2FgAHWAAEAAAAAAAAAAAAAAAAAAAAJANUAAAEsAAABLADXAQAAAAEAAAABAAAAAQAAAAEAAKoBAAAAAAAAAAAAACEAAABYAAAAkQAAANUAAAEOAAABVAAAAZkAAAHTAAACGgABAAAACQAKAAIAAAAAAAIAgAQAAAAAAAQAAGUAAAAAAAAAFQECAAAAAAAAAAEAJgAAAAAAAAAAAAIADgAmAAAAAAAAAAMARAA0AAAAAAAAAAQAJgB4AAAAAAAAAAUAFgCeAAAAAAAAAAYAEwC0AAAAAAAAAAgAHADHAAEAAAAAAAEAJgAAAAEAAAAAAAIADgAmAAEAAAAAAAMARAA0AAEAAAAAAAQAJgB4AAEAAAAAAAUAFgCeAAEAAAAAAAYAEwC0AAEAAAAAAAgAHADHAAMAAQQJAAEAJgAAAAMAAQQJAAIADgAmAAMAAQQJAAMARAA0AAMAAQQJAAQAJgB4AAMAAQQJAAUAFgCeAAMAAQQJAAYAEwC0AAMAAQQJAAgAHADHAEIAcgBhAGMAawBlAHQAcwAgAHMAbQBhAGwAbAAgAHMAaQB6AGUAUgBlAGcAdQBsAGEAcgBNAGEAdABoAHMAIABGAG8AcgAgAE0AbwByAGUAIABCAHIAYQBjAGsAZQB0AHMAIABzAG0AYQBsAGwAIABzAGkAegBlAEIAcgBhAGMAawBlAHQAcwAgAHMAbQBhAGwAbAAgAHMAaQB6AGUAVgBlAHIAcwBpAG8AbgAgADIALgAwQnJhY2tldHNfc21hbGxfc2l6ZQBNAGEAdABoAHMAIABGAG8AcgAgAE0AbwByAGUAAAAAAwAAAAAAAACqAFUAAAAAAAAAAAAAAAAAAAAAAAAAALkH%2FwACjYUA)format('truetype')%3Bfont-weight%3Anormal%3Bfont-style%3Anormal%3B%7D%40font-face%7Bfont-family%3A'round_brackets18549f92a457f2409'%3Bsrc%3Aurl(data%3Afont%2Ftruetype%3Bcharset%3Dutf-8%3Bbase64%2CAAEAAAAMAIAAAwBAT1MvMjwHLFQAAADMAAAATmNtYXDf7xCrAAABHAAAADxjdnQgBAkDLgAAAVgAAAASZ2x5ZmAOz2cAAAFsAAABJGhlYWQOKih8AAACkAAAADZoaGVhCvgVwgAAAsgAAAAkaG10eCA6AAIAAALsAAAADGxvY2EAAARLAAAC%2BAAAABBtYXhwBIgEWQAAAwgAAAAgbmFtZXHR30MAAAMoAAACOXBvc3QDogHPAAAFZAAAACBwcmVwupWEAAAABYQAAAAHAAAGcgGQAAUAAAgACAAAAAAACAAIAAAAAAAAAQIAAAAAAAAAAAAAAAAAAAAAAAAAAAAAAAAAAAAAACAgICAAAAAo8AMGe%2F57AAAHPgGyAAAAAAACAAEAAQAAABQAAwABAAAAFAAEACgAAAAGAAQAAQACACgAKf%2F%2FAAAAKAAp%2F%2F%2F%2F2f%2FZAAEAAAAAAAAAAAFUAFYBAAAsAKgDgAAyAAcAAAACAAAAKgDVA1UAAwAHAAA1MxEjEyMRM9XVq4CAKgMr%2FQAC1QABAAD%2B0AIgBtAACQBNGAGwChCwA9SwAxCwAtSwChCwBdSwBRCwANSwAxCwBzywAhCwCDwAsAoQsAPUsAMQsAfUsAoQsAXUsAoQsADUsAMQsAI8sAcQsAg8MTAREAEzABEQASMAAZCQ%2FnABkJD%2BcALQ%2FZD%2BcAGQAnACcAGQ%2FnAAAQAA%2FtACIAbQAAkATRgBsAoQsAPUsAMQsALUsAoQsAXUsAUQsADUsAMQsAc8sAIQsAg8ALAKELAD1LADELAH1LAKELAF1LAKELAA1LADELACPLAHELAIPDEwARABIwAREAEzAAIg%2FnCQAZD%2BcJABkALQ%2FZD%2BcAGQAnACcAGQ%2FnAAAQAAAAEAAPW2NYFfDzz1AAMIAP%2F%2F%2F%2F%2FVre7u%2F%2F%2F%2F%2F9Wt7u4AAP7QA7cG0AAAAAoAAgABAAAAAAABAAAHPv5OAAAXcAAA%2F%2F4DtwABAAAAAAAAAAAAAAAAAAAAAwDVAAACIAAAAiAAAAAAAAAAAAAkAAAAowAAASQAAQAAAAMACgACAAAAAAACAIAEAAAAAAAEAABNAAAAAAAAABUBAgAAAAAAAAABAD4AAAAAAAAAAAACAA4APgAAAAAAAAADAFwATAAAAAAAAAAEAD4AqAAAAAAAAAAFABYA5gAAAAAAAAAGAB8A%2FAAAAAAAAAAIABwBGwABAAAAAAABAD4AAAABAAAAAAACAA4APgABAAAAAAADAFwATAABAAAAAAAEAD4AqAABAAAAAAAFABYA5gABAAAAAAAGAB8A%2FAABAAAAAAAIABwBGwADAAEECQABAD4AAAADAAEECQACAA4APgADAAEECQADAFwATAADAAEECQAEAD4AqAADAAEECQAFABYA5gADAAEECQAGAB8A%2FAADAAEECQAIABwBGwBSAG8AdQBuAGQAIABiAHIAYQBjAGsAZQB0AHMAIAB3AGkAdABoACAAYQBzAGMAZQBuAHQAIAAxADgANQA0AFIAZQBnAHUAbABhAHIATQBhAHQAaABzACAARgBvAHIAIABNAG8AcgBlACAAUgBvAHUAbgBkACAAYgByAGEAYwBrAGUAdABzACAAdwBpAHQAaAAgAGEAcwBjAGUAbgB0ACAAMQA4ADUANABSAG8AdQBuAGQAIABiAHIAYQBjAGsAZQB0AHMAIAB3AGkAdABoACAAYQBzAGMAZQBuAHQAIAAxADgANQA0AFYAZQByAHMAaQBvAG4AIAAyAC4AMFJvdW5kX2JyYWNrZXRzX3dpdGhfYXNjZW50XzE4NTQATQBhAHQAaABzACAARgBvAHIAIABNAG8AcgBlAAAAAAMAAAAAAAADnwHPAAAAAAAAAAAAAAAAAAAAAAAAAAC5B%2F8AAY2FAA%3D%3D)format('truetype')%3Bfont-weight%3Anormal%3Bfont-style%3Anormal%3B%7D%40font-face%7Bfont-family%3A'bracketse552f5417ff4680c6b50499'%3Bsrc%3Aurl(data%3Afont%2Ftruetype%3Bcharset%3Dutf-8%3Bbase64%2CAAEAAAAMAIAAAwBAT1MvMi7RIisAAADMAAAATmNtYXBi7uzYAAABHAAAAExjdnQgBAkDLgAAAWgAAAASZ2x5Zo64f%2BkAAAF8AAABSWhlYWQLniGcAAACyAAAADZoaGVhBK4XLAAAAwAAAAAkaG10eCWq%2F90AAAMkAAAAFGxvY2EAABknAAADOAAAABhtYXhwBJIESAAAA1AAAAAgbmFtZRAA8I4AAANwAAAB3nBvc3QBwwDgAAAFUAAAACBwcmVwupWEAAAABXAAAAAHAAACggGQAAUAAAQABAAAAAAABAAEAAAAAAAAAQEAAAAAAAAAAAAAAAAAAAAAAAAAAAAAAAAAAAAAACAgICAAAAAg9AMEAAAAAAADgAAAAAAAAAACAAEAAQAAABQAAwABAAAAFAAEADgAAAAKAAgAAgACI5sjnSOeI6D%2F%2FwAAI5sjnSOeI6D%2F%2F9xm3GXcZdxkAAEAAAAAAAAAAAAAAAABVABWAQAALACoA4AAMgAHAAAAAgAAACoA1QNVAAMABwAANTMRIxMjETPV1auAgCoDK%2F0AAtUAAQAAAAABgAOAAAUAJBgBsAAvsAPFsQEC%2FbADELEEBP0AsQAAP7ABPLEEBj%2BwAzwwMTEzEAEjAFUBKyv%2BqwH8AYT%2BqgABAAAAAAGAA4AABQAmGAGwAC6wA8WxBQL9sAMQsQIE%2FQB8sQAGPxiwBTyxAwb2sAI8MDEREgEzABMBAVQr%2FtMCA4D91v6qAYQB%2FAAB%2F6wAAAEsA4AABQAnGAGwAC%2BwBzywA8WxAQL9sAMQsQQE%2FQCxAAA%2FsAE8sQQGP7ADPDAxISMSATMAASxVAf7UKwFVAfwBhP6rAAH%2FrAAAASwDgAAFACkYAbABL7AHPLAExbEAAv2wBBCxAwT9AHyxAQY%2FsAA8GLEEAD%2BwAzwwMRMzEAEjANdV%2FqsrASsDgP3V%2FqsBhgAAAAABAAAAAQAAeuTcpl8PPPUAAwQA%2F%2F%2F%2F%2F9Wt7o7%2F%2F%2F%2F%2F1a3ujv%2BsAAABgAOAAAAACgACAAEAAAAAAAEAAAOAAAAAABdw%2F6z%2FrAGAAAEAAAAAAAAAAAAAAAAAAAAFANUAAAEsAAABLAAAASz%2FrAEs%2F6wAAAAAAAAAJAAAAGgAAACzAAAA%2FQAAAUkAAQAAAAUACAACAAAAAAACAIAEAAAAAAAEAAA%2BAAAAAAAAABUBAgAAAAAAAAABACQAAAAAAAAAAAACAA4AJAAAAAAAAAADAEIAMgAAAAAAAAAEACQAdAAAAAAAAAAFABYAmAAAAAAAAAAGABIArgAAAAAAAAAIABwAwAABAAAAAAABACQAAAABAAAAAAACAA4AJAABAAAAAAADAEIAMgABAAAAAAAEACQAdAABAAAAAAAFABYAmAABAAAAAAAGABIArgABAAAAAAAIABwAwAADAAEECQABACQAAAADAAEECQACAA4AJAADAAEECQADAEIAMgADAAEECQAEACQAdAADAAEECQAFABYAmAADAAEECQAGABIArgADAAEECQAIABwAwABCAHIAYQBjAGsAZQB0AHMAIABmAHUAbABsACAAcwBpAHoAZQBSAGUAZwB1AGwAYQByAE0AYQB0AGgAcwAgAEYAbwByACAATQBvAHIAZQAgAEIAcgBhAGMAawBlAHQAcwAgAGYAdQBsAGwAIABzAGkAegBlAEIAcgBhAGMAawBlAHQAcwAgAGYAdQBsAGwAIABzAGkAegBlAFYAZQByAHMAaQBvAG4AIAAyAC4AMEJyYWNrZXRzX2Z1bGxfc2l6ZQBNAGEAdABoAHMAIABGAG8AcgAgAE0AbwByAGUAAAADAAAAAAAAAcAA4AAAAAAAAAAAAAAAAAAAAAAAAAAAuQf%2FAAGNhQA%3D)format('truetype')%3Bfont-weight%3Anormal%3Bfont-style%3Anormal%3B%7D%3C%2Fstyle%3E%3C%2Fdefs%3E%3Ctext%20font-family%3D%22aec8956637a99787bd197eacd77acce%22%20font-size%3D%2216%22%20font-style%3D%22italic%22%20text-anchor%3D%22middle%22%20x%3D%223.5%22%20y%3D%2256%22%3Ef%3C%2Ftext%3E%3Ctext%20font-family%3D%22round_brackets18549f92a457f2409%22%20font-size%3D%2216%22%20text-anchor%3D%22middle%22%20x%3D%2212.5%22%20y%3D%2256%22%3E(%3C%2Ftext%3E%3Ctext%20font-family%3D%22Arial%22%20font-size%3D%2216%22%20font-style%3D%22italic%22%20text-anchor%3D%22middle%22%20x%3D%2219.5%22%20y%3D%2256%22%3EF%3C%2Ftext%3E%3Ctext%20font-family%3D%22round_brackets18549f92a457f2409%22%20font-size%3D%2216%22%20text-anchor%3D%22middle%22%20x%3D%2227.5%22%20y%3D%2256%22%3E)%3C%2Ftext%3E%3Ctext%20font-family%3D%22math1208fbb20a771f2e9bb368f9212%22%20font-size%3D%2216%22%20text-anchor%3D%22middle%22%20x%3D%2238.5%22%20y%3D%2256%22%3E%3D%3C%2Ftext%3E%3Cline%20stroke%3D%22%23000000%22%20stroke-linecap%3D%22square%22%20stroke-width%3D%221%22%20x1%3D%2249.5%22%20x2%3D%22123.5%22%20y1%3D%2250.5%22%20y2%3D%2250.5%22%2F%3E%3Ctext%20font-family%3D%22brack_sme7112986b8ab9304894f510%22%20font-size%3D%2216%22%20text-anchor%3D%22start%22%20x%3D%2271.5%22%20y%3D%2213%22%3E%26%23x23A1%3B%3C%2Ftext%3E%3Ctext%20font-family%3D%22brack_sme7112986b8ab9304894f510%22%20font-size%3D%2216%22%20text-anchor%3D%22start%22%20x%3D%2271.5%22%20y%3D%2218%22%3E%26%23x23A2%3B%3C%2Ftext%3E%3Ctext%20font-family%3D%22brack_sme7112986b8ab9304894f510%22%20font-size%3D%2216%22%20text-anchor%3D%22start%22%20x%3D%2271.5%22%20y%3D%2223%22%3E%26%23x23A2%3B%3C%2Ftext%3E%3Ctext%20font-family%3D%22brack_sme7112986b8ab9304894f510%22%20font-size%3D%2216%22%20text-anchor%3D%22start%22%20x%3D%2271.5%22%20y%3D%2228%22%3E%26%23x23A2%3B%3C%2Ftext%3E%3Ctext%20font-family%3D%22brack_sme7112986b8ab9304894f510%22%20font-size%3D%2216%22%20text-anchor%3D%22start%22%20x%3D%2271.5%22%20y%3D%2233%22%3E%26%23x23A2%3B%3C%2Ftext%3E%3Ctext%20font-family%3D%22brack_sme7112986b8ab9304894f510%22%20font-size%3D%2216%22%20text-anchor%3D%22start%22%20x%3D%2271.5%22%20y%3D%2238%22%3E%26%23x23A2%3B%3C%2Ftext%3E%3Ctext%20font-family%3D%22brack_sme7112986b8ab9304894f510%22%20font-size%3D%2216%22%20text-anchor%3D%22start%22%20x%3D%2271.5%22%20y%3D%2243%22%3E%26%23x23A2%3B%3C%2Ftext%3E%3Ctext%20font-family%3D%22brack_sme7112986b8ab9304894f510%22%20font-size%3D%2216%22%20text-anchor%3D%22start%22%20x%3D%2271.5%22%20y%3D%2248%22%3E%26%23x23A3%3B%3C%2Ftext%3E%3Ctext%20font-family%3D%22brack_sme7112986b8ab9304894f510%22%20font-size%3D%2216%22%20text-anchor%3D%22start%22%20x%3D%2299.5%22%20y%3D%2213%22%3E%26%23x23A4%3B%3C%2Ftext%3E%3Ctext%20font-family%3D%22brack_sme7112986b8ab9304894f510%22%20font-size%3D%2216%22%20text-anchor%3D%22start%22%20x%3D%2299.5%22%20y%3D%2218%22%3E%26%23x23A5%3B%3C%2Ftext%3E%3Ctext%20font-family%3D%22brack_sme7112986b8ab9304894f510%22%20font-size%3D%2216%22%20text-anchor%3D%22start%22%20x%3D%2299.5%22%20y%3D%2223%22%3E%26%23x23A5%3B%3C%2Ftext%3E%3Ctext%20font-family%3D%22brack_sme7112986b8ab9304894f510%22%20font-size%3D%2216%22%20text-anchor%3D%22start%22%20x%3D%2299.5%22%20y%3D%2228%22%3E%26%23x23A5%3B%3C%2Ftext%3E%3Ctext%20font-family%3D%22brack_sme7112986b8ab9304894f510%22%20font-size%3D%2216%22%20text-anchor%3D%22start%22%20x%3D%2299.5%22%20y%3D%2233%22%3E%26%23x23A5%3B%3C%2Ftext%3E%3Ctext%20font-family%3D%22brack_sme7112986b8ab9304894f510%22%20font-size%3D%2216%22%20text-anchor%3D%22start%22%20x%3D%2299.5%22%20y%3D%2238%22%3E%26%23x23A5%3B%3C%2Ftext%3E%3Ctext%20font-family%3D%22brack_sme7112986b8ab9304894f510%22%20font-size%3D%2216%22%20text-anchor%3D%22start%22%20x%3D%2299.5%22%20y%3D%2243%22%3E%26%23x23A5%3B%3C%2Ftext%3E%3Ctext%20font-family%3D%22brack_sme7112986b8ab9304894f510%22%20font-size%3D%2216%22%20text-anchor%3D%22start%22%20x%3D%2299.5%22%20y%3D%2248%22%3E%26%23x23A6%3B%3C%2Ftext%3E%3Cline%20stroke%3D%22%23000000%22%20stroke-linecap%3D%22square%22%20stroke-width%3D%221%22%20x1%3D%2278.5%22%20x2%3D%2295.5%22%20y1%3D%2228.5%22%20y2%3D%2228.5%22%2F%3E%3Ctext%20font-family%3D%22Arial%22%20font-size%3D%2216%22%20font-style%3D%22italic%22%20text-anchor%3D%22middle%22%20x%3D%2286.5%22%20y%3D%2223%22%3Em%3C%2Ftext%3E%3Ctext%20font-family%3D%22Arial%22%20font-size%3D%2216%22%20font-style%3D%22italic%22%20text-anchor%3D%22middle%22%20x%3D%2286.5%22%20y%3D%2245%22%3En%3C%2Ftext%3E%3Ctext%20font-family%3D%22Arial%22%20font-size%3D%2216%22%20font-style%3D%22italic%22%20text-anchor%3D%22middle%22%20x%3D%2256.5%22%20y%3D%2278%22%3EB%3C%2Ftext%3E%3Ctext%20font-family%3D%22bracketse552f5417ff4680c6b50499%22%20font-size%3D%2216%22%20text-anchor%3D%22start%22%20x%3D%2264.5%22%20y%3D%2267%22%3E%26%23x239B%3B%3C%2Ftext%3E%3Ctext%20font-family%3D%22brack_sme7112986b8ab9304894f510%22%20font-size%3D%2216%22%20text-anchor%3D%22start%22%20x%3D%2264.5%22%20y%3D%2272%22%3E%26%23x239C%3B%3C%2Ftext%3E%3Ctext%20font-family%3D%22brack_sme7112986b8ab9304894f510%22%20font-size%3D%2216%22%20text-anchor%3D%22start%22%20x%3D%2264.5%22%20y%3D%2277%22%3E%26%23x239C%3B%3C%2Ftext%3E%3Ctext%20font-family%3D%22bracketse552f5417ff4680c6b50499%22%20font-size%3D%2216%22%20text-anchor%3D%22start%22%20x%3D%2264.5%22%20y%3D%2291%22%3E%26%23x239D%3B%3C%2Ftext%3E%3Ctext%20font-family%3D%22bracketse552f5417ff4680c6b50499%22%20font-size%3D%2216%22%20text-anchor%3D%22start%22%20x%3D%22116.5%22%20y%3D%2267%22%3E%26%23x239E%3B%3C%2Ftext%3E%3Ctext%20font-family%3D%22brack_sme7112986b8ab9304894f510%22%20font-size%3D%2216%22%20text-anchor%3D%22start%22%20x%3D%22116.5%22%20y%3D%2272%22%3E%26%23x239F%3B%3C%2Ftext%3E%3Ctext%20font-family%3D%22brack_sme7112986b8ab9304894f510%22%20font-size%3D%2216%22%20text-anchor%3D%22start%22%20x%3D%22116.5%22%20y%3D%2277%22%3E%26%23x239F%3B%3C%2Ftext%3E%3Ctext%20font-family%3D%22bracketse552f5417ff4680c6b50499%22%20font-size%3D%2216%22%20text-anchor%3D%22start%22%20x%3D%22116.5%22%20y%3D%2291%22%3E%26%23x23A0%3B%3C%2Ftext%3E%3Cline%20stroke%3D%22%23000000%22%20stroke-linecap%3D%22square%22%20stroke-width%3D%221%22%20x1%3D%2272.5%22%20x2%3D%2289.5%22%20y1%3D%2272.5%22%20y2%3D%2272.5%22%2F%3E%3Ctext%20font-family%3D%22Arial%22%20font-size%3D%2216%22%20font-style%3D%22italic%22%20text-anchor%3D%22middle%22%20x%3D%2280.5%22%20y%3D%2267%22%3Em%3C%2Ftext%3E%3Ctext%20font-family%3D%22Arial%22%20font-size%3D%2216%22%20text-anchor%3D%22middle%22%20x%3D%2281.5%22%20y%3D%2289%22%3E2%3C%2Ftext%3E%3Ctext%20font-family%3D%22math1208fbb20a771f2e9bb368f9212%22%20font-size%3D%2216%22%20text-anchor%3D%22middle%22%20x%3D%2294.5%22%20y%3D%2278%22%3E%2C%3C%2Ftext%3E%3Cline%20stroke%3D%22%23000000%22%20stroke-linecap%3D%22square%22%20stroke-width%3D%221%22%20x1%3D%2299.5%22%20x2%3D%22112.5%22%20y1%3D%2272.5%22%20y2%3D%2272.5%22%2F%3E%3Ctext%20font-family%3D%22Arial%22%20font-size%3D%2216%22%20font-style%3D%22italic%22%20text-anchor%3D%22middle%22%20x%3D%22105.5%22%20y%3D%2267%22%3En%3C%2Ftext%3E%3Ctext%20font-family%3D%22Arial%22%20font-size%3D%2216%22%20text-anchor%3D%22middle%22%20x%3D%22106.5%22%20y%3D%2289%22%3E2%3C%2Ftext%3E%3Cline%20stroke%3D%22%23000000%22%20stroke-linecap%3D%22square%22%20stroke-width%3D%221%22%20x1%3D%22128.5%22%20x2%3D%22234.5%22%20y1%3D%2250.5%22%20y2%3D%2250.5%22%2F%3E%3Ctext%20font-family%3D%22brack_sme7112986b8ab9304894f510%22%20font-size%3D%2216%22%20text-anchor%3D%22start%22%20x%3D%22142.5%22%20y%3D%2213%22%3E%26%23x23A1%3B%3C%2Ftext%3E%3Ctext%20font-family%3D%22brack_sme7112986b8ab9304894f510%22%20font-size%3D%2216%22%20text-anchor%3D%22start%22%20x%3D%22142.5%22%20y%3D%2218%22%3E%26%23x23A2%3B%3C%2Ftext%3E%3Ctext%20font-family%3D%22brack_sme7112986b8ab9304894f510%22%20font-size%3D%2216%22%20text-anchor%3D%22start%22%20x%3D%22142.5%22%20y%3D%2223%22%3E%26%23x23A2%3B%3C%2Ftext%3E%3Ctext%20font-family%3D%22brack_sme7112986b8ab9304894f510%22%20font-size%3D%2216%22%20text-anchor%3D%22start%22%20x%3D%22142.5%22%20y%3D%2228%22%3E%26%23x23A2%3B%3C%2Ftext%3E%3Ctext%20font-family%3D%22brack_sme7112986b8ab9304894f510%22%20font-size%3D%2216%22%20text-anchor%3D%22start%22%20x%3D%22142.5%22%20y%3D%2233%22%3E%26%23x23A2%3B%3C%2Ftext%3E%3Ctext%20font-family%3D%22brack_sme7112986b8ab9304894f510%22%20font-size%3D%2216%22%20text-anchor%3D%22start%22%20x%3D%22142.5%22%20y%3D%2238%22%3E%26%23x23A2%3B%3C%2Ftext%3E%3Ctext%20font-family%3D%22brack_sme7112986b8ab9304894f510%22%20font-size%3D%2216%22%20text-anchor%3D%22start%22%20x%3D%22142.5%22%20y%3D%2243%22%3E%26%23x23A2%3B%3C%2Ftext%3E%3Ctext%20font-family%3D%22brack_sme7112986b8ab9304894f510%22%20font-size%3D%2216%22%20text-anchor%3D%22start%22%20x%3D%22142.5%22%20y%3D%2248%22%3E%26%23x23A3%3B%3C%2Ftext%3E%3Ctext%20font-family%3D%22brack_sme7112986b8ab9304894f510%22%20font-size%3D%2216%22%20text-anchor%3D%22start%22%20x%3D%22181.5%22%20y%3D%2213%22%3E%26%23x23A4%3B%3C%2Ftext%3E%3Ctext%20font-family%3D%22brack_sme7112986b8ab9304894f510%22%20font-size%3D%2216%22%20text-anchor%3D%22start%22%20x%3D%22181.5%22%20y%3D%2218%22%3E%26%23x23A5%3B%3C%2Ftext%3E%3Ctext%20font-family%3D%22brack_sme7112986b8ab9304894f510%22%20font-size%3D%2216%22%20text-anchor%3D%22start%22%20x%3D%22181.5%22%20y%3D%2223%22%3E%26%23x23A5%3B%3C%2Ftext%3E%3Ctext%20font-family%3D%22brack_sme7112986b8ab9304894f510%22%20font-size%3D%2216%22%20text-anchor%3D%22start%22%20x%3D%22181.5%22%20y%3D%2228%22%3E%26%23x23A5%3B%3C%2Ftext%3E%3Ctext%20font-family%3D%22brack_sme7112986b8ab9304894f510%22%20font-size%3D%2216%22%20text-anchor%3D%22start%22%20x%3D%22181.5%22%20y%3D%2233%22%3E%26%23x23A5%3B%3C%2Ftext%3E%3Ctext%20font-family%3D%22brack_sme7112986b8ab9304894f510%22%20font-size%3D%2216%22%20text-anchor%3D%22start%22%20x%3D%22181.5%22%20y%3D%2238%22%3E%26%23x23A5%3B%3C%2Ftext%3E%3Ctext%20font-family%3D%22brack_sme7112986b8ab9304894f510%22%20font-size%3D%2216%22%20text-anchor%3D%22start%22%20x%3D%22181.5%22%20y%3D%2243%22%3E%26%23x23A5%3B%3C%2Ftext%3E%3Ctext%20font-family%3D%22brack_sme7112986b8ab9304894f510%22%20font-size%3D%2216%22%20text-anchor%3D%22start%22%20x%3D%22181.5%22%20y%3D%2248%22%3E%26%23x23A6%3B%3C%2Ftext%3E%3Cline%20stroke%3D%22%23000000%22%20stroke-linecap%3D%22square%22%20stroke-width%3D%221%22%20x1%3D%22149.5%22%20x2%3D%22166.5%22%20y1%3D%2228.5%22%20y2%3D%2228.5%22%2F%3E%3Ctext%20font-family%3D%22Arial%22%20font-size%3D%2216%22%20font-style%3D%22italic%22%20text-anchor%3D%22middle%22%20x%3D%22157.5%22%20y%3D%2223%22%3Em%3C%2Ftext%3E%3Ctext%20font-family%3D%22Arial%22%20font-size%3D%2216%22%20font-style%3D%22italic%22%20text-anchor%3D%22middle%22%20x%3D%22157.5%22%20y%3D%2245%22%3En%3C%2Ftext%3E%3Ctext%20font-family%3D%22Arial%22%20font-size%3D%2216%22%20font-style%3D%22italic%22%20text-anchor%3D%22middle%22%20x%3D%22174.5%22%20y%3D%2234%22%3EF%3C%2Ftext%3E%3Cline%20stroke%3D%22%23000000%22%20stroke-linecap%3D%22square%22%20stroke-width%3D%221%22%20x1%3D%22187.5%22%20x2%3D%22201.5%22%20y1%3D%2215.5%22%20y2%3D%2215.5%22%2F%3E%3Ctext%20font-family%3D%22Arial%22%20font-size%3D%2212%22%20font-style%3D%22italic%22%20text-anchor%3D%22middle%22%20x%3D%22194.5%22%20y%3D%2211%22%3Em%3C%2Ftext%3E%3Ctext%20font-family%3D%22Arial%22%20font-size%3D%2212%22%20text-anchor%3D%22middle%22%20x%3D%22194.5%22%20y%3D%2227%22%3E2%3C%2Ftext%3E%3Ctext%20font-family%3D%22math1208fbb20a771f2e9bb368f9212%22%20font-size%3D%2212%22%20text-anchor%3D%22middle%22%20x%3D%22209.5%22%20y%3D%2220%22%3E%26%23x2212%3B%3C%2Ftext%3E%3Ctext%20font-family%3D%22Arial%22%20font-size%3D%2212%22%20text-anchor%3D%22middle%22%20x%3D%22218.5%22%20y%3D%2220%22%3E1%3C%2Ftext%3E%3Ctext%20font-family%3D%22brack_sme7112986b8ab9304894f510%22%20font-size%3D%2216%22%20text-anchor%3D%22start%22%20x%3D%22131.5%22%20y%3D%2271%22%3E%26%23x23A1%3B%3C%2Ftext%3E%3Ctext%20font-family%3D%22brack_sme7112986b8ab9304894f510%22%20font-size%3D%2216%22%20text-anchor%3D%22start%22%20x%3D%22131.5%22%20y%3D%2276%22%3E%26%23x23A2%3B%3C%2Ftext%3E%3Ctext%20font-family%3D%22brack_sme7112986b8ab9304894f510%22%20font-size%3D%2216%22%20text-anchor%3D%22start%22%20x%3D%22131.5%22%20y%3D%2281%22%3E%26%23x23A2%3B%3C%2Ftext%3E%3Ctext%20font-family%3D%22brack_sme7112986b8ab9304894f510%22%20font-size%3D%2216%22%20text-anchor%3D%22start%22%20x%3D%22131.5%22%20y%3D%2286%22%3E%26%23x23A2%3B%3C%2Ftext%3E%3Ctext%20font-family%3D%22brack_sme7112986b8ab9304894f510%22%20font-size%3D%2216%22%20text-anchor%3D%22start%22%20x%3D%22131.5%22%20y%3D%2291%22%3E%26%23x23A2%3B%3C%2Ftext%3E%3Ctext%20font-family%3D%22brack_sme7112986b8ab9304894f510%22%20font-size%3D%2216%22%20text-anchor%3D%22start%22%20x%3D%22131.5%22%20y%3D%2296%22%3E%26%23x23A3%3B%3C%2Ftext%3E%3Ctext%20font-family%3D%22brack_sme7112986b8ab9304894f510%22%20font-size%3D%2216%22%20text-anchor%3D%22start%22%20x%3D%22191.5%22%20y%3D%2271%22%3E%26%23x23A4%3B%3C%2Ftext%3E%3Ctext%20font-family%3D%22brack_sme7112986b8ab9304894f510%22%20font-size%3D%2216%22%20text-anchor%3D%22start%22%20x%3D%22191.5%22%20y%3D%2276%22%3E%26%23x23A5%3B%3C%2Ftext%3E%3Ctext%20font-family%3D%22brack_sme7112986b8ab9304894f510%22%20font-size%3D%2216%22%20text-anchor%3D%22start%22%20x%3D%22191.5%22%20y%3D%2281%22%3E%26%23x23A5%3B%3C%2Ftext%3E%3Ctext%20font-family%3D%22brack_sme7112986b8ab9304894f510%22%20font-size%3D%2216%22%20text-anchor%3D%22start%22%20x%3D%22191.5%22%20y%3D%2286%22%3E%26%23x23A5%3B%3C%2Ftext%3E%3Ctext%20font-family%3D%22brack_sme7112986b8ab9304894f510%22%20font-size%3D%2216%22%20text-anchor%3D%22start%22%20x%3D%22191.5%22%20y%3D%2291%22%3E%26%23x23A5%3B%3C%2Ftext%3E%3Ctext%20font-family%3D%22brack_sme7112986b8ab9304894f510%22%20font-size%3D%2216%22%20text-anchor%3D%22start%22%20x%3D%22191.5%22%20y%3D%2296%22%3E%26%23x23A6%3B%3C%2Ftext%3E%3Ctext%20font-family%3D%22Arial%22%20font-size%3D%2216%22%20text-anchor%3D%22middle%22%20x%3D%22140.5%22%20y%3D%2287%22%3E1%3C%2Ftext%3E%3Ctext%20font-family%3D%22math1208fbb20a771f2e9bb368f9212%22%20font-size%3D%2216%22%20text-anchor%3D%22middle%22%20x%3D%22152.5%22%20y%3D%2287%22%3E%2B%3C%2Ftext%3E%3Cline%20stroke%3D%22%23000000%22%20stroke-linecap%3D%22square%22%20stroke-width%3D%221%22%20x1%3D%22162.5%22%20x2%3D%22176.5%22%20y1%3D%2281.5%22%20y2%3D%2281.5%22%2F%3E%3Ctext%20font-family%3D%22Arial%22%20font-size%3D%2212%22%20font-style%3D%22italic%22%20text-anchor%3D%22middle%22%20x%3D%22169.5%22%20y%3D%2276%22%3Em%3C%2Ftext%3E%3Ctext%20font-family%3D%22Arial%22%20font-size%3D%2212%22%20font-style%3D%22italic%22%20text-anchor%3D%22middle%22%20x%3D%22169.5%22%20y%3D%2294%22%3En%3C%2Ftext%3E%3Ctext%20font-family%3D%22Arial%22%20font-size%3D%2216%22%20font-style%3D%22italic%22%20text-anchor%3D%22middle%22%20x%3D%22184.5%22%20y%3D%2287%22%3EF%3C%2Ftext%3E%3Cline%20stroke%3D%22%23000000%22%20stroke-linecap%3D%22square%22%20stroke-width%3D%221%22%20x1%3D%22197.5%22%20x2%3D%22231.5%22%20y1%3D%2268.5%22%20y2%3D%2268.5%22%2F%3E%3Ctext%20font-family%3D%22Arial%22%20font-size%3D%2212%22%20font-style%3D%22italic%22%20text-anchor%3D%22middle%22%20x%3D%22204.5%22%20y%3D%2264%22%3Em%3C%2Ftext%3E%3Ctext%20font-family%3D%22math1208fbb20a771f2e9bb368f9212%22%20font-size%3D%2212%22%20text-anchor%3D%22middle%22%20x%3D%22216.5%22%20y%3D%2264%22%3E%2B%3C%2Ftext%3E%3Ctext%20font-family%3D%22Arial%22%20font-size%3D%2212%22%20font-style%3D%22italic%22%20text-anchor%3D%22middle%22%20x%3D%22225.5%22%20y%3D%2264%22%3En%3C%2Ftext%3E%3Ctext%20font-family%3D%22Arial%22%20font-size%3D%2212%22%20text-anchor%3D%22middle%22%20x%3D%22214.5%22%20y%3D%2280%22%3E2%3C%2Ftext%3E%3Ctext%20font-family%3D%22math1208fbb20a771f2e9bb368f9212%22%20font-size%3D%2216%22%20text-anchor%3D%22middle%22%20x%3D%22247.5%22%20y%3D%2256%22%3E%2C%3C%2Ftext%3E%3Ctext%20font-family%3D%22Arial%22%20font-size%3D%2216%22%20text-anchor%3D%22middle%22%20x%3D%22254.5%22%20y%3D%2256%22%3E0%3C%2Ftext%3E%3Ctext%20font-family%3D%22math1208fbb20a771f2e9bb368f9212%22%20font-size%3D%2216%22%20text-anchor%3D%22middle%22%20x%3D%22267.5%22%20y%3D%2256%22%3E%26%23x2264%3B%3C%2Ftext%3E%3Ctext%20font-family%3D%22Arial%22%20font-size%3D%2216%22%20font-style%3D%22italic%22%20text-anchor%3D%22middle%22%20x%3D%22280.5%22%20y%3D%2256%22%3EF%3C%2Ftext%3E%3Ctext%20font-family%3D%22math1208fbb20a771f2e9bb368f9212%22%20font-size%3D%2216%22%20text-anchor%3D%22middle%22%20x%3D%22294.5%22%20y%3D%2256%22%3E%26%23x2264%3B%3C%2Ftext%3E%3Ctext%20font-family%3D%22math1208fbb20a771f2e9bb368f9212%22%20font-size%3D%2216%22%20text-anchor%3D%22middle%22%20x%3D%22311.5%22%20y%3D%2256%22%3E%26%23x221E%3B%3C%2Ftext%3E%3C%2Fsvg%3E)
%3C%2Fmo%3E%3C%2Fmrow%3E%3C%2Fmsub%3E%3Cmo%3E%26%23x2265%3B%3C%2Fmo%3E%3Cmsub%3E%3Cmi%3EF%3C%2Fmi%3E%3Cmrow%3E%3Cmo%3E(%3C%2Fmo%3E%3Cmi%3E%26%23x3B1%3B%3C%2Fmi%3E%3Cmo%3E%3B%3C%2Fmo%3E%3Cmi%3Em%3C%2Fmi%3E%3Cmo%3E%2C%3C%2Fmo%3E%3Cmi%3En%3C%2Fmi%3E%3Cmo%3E)%3C%2Fmo%3E%3C%2Fmrow%3E%3C%2Fmsub%3E%3Cmo%3E%5D%3C%2Fmo%3E%3Cmo%3E%3D%3C%2Fmo%3E%3Cmi%3E%26%23x3B1%3B%3C%2Fmi%3E%3Cmo%3E%26%23xA0%3B%3C%2Fmo%3E%3Cmo%3E%26%23xA0%3B%3C%2Fmo%3E%3Cmo%3E%26%23xA0%3B%3C%2Fmo%3E%3Cmspace%20linebreak%3D%22newline%22%2F%3E%3Cmi%3El%3C%2Fmi%3E%3Cmo%3E.%3C%2Fmo%3E%3Cmi%3Ee%3C%2Fmi%3E%3Cmspace%20linebreak%3D%22newline%22%2F%3E%3Cmi%3EP%3C%2Fmi%3E%3Cmfenced%20close%3D%22%5D%22%20open%3D%22%5B%22%3E%3Cmrow%3E%3Cmo%3E%26%23xA0%3B%3C%2Fmo%3E%3Cmfrac%3E%3Cmn%3E1%3C%2Fmn%3E%3Cmsub%3E%3Cmi%3EF%3C%2Fmi%3E%3Cmrow%3E%3Cmo%3E(%3C%2Fmo%3E%3Cmi%3Em%3C%2Fmi%3E%3Cmo%3E%2C%3C%2Fmo%3E%3Cmi%3En%3C%2Fmi%3E%3Cmo%3E)%3C%2Fmo%3E%3C%2Fmrow%3E%3C%2Fmsub%3E%3C%2Fmfrac%3E%3Cmo%3E%26%23x2264%3B%3C%2Fmo%3E%3Cmfrac%3E%3Cmn%3E1%3C%2Fmn%3E%3Cmsub%3E%3Cmi%3EF%3C%2Fmi%3E%3Cmrow%3E%3Cmo%3E(%3C%2Fmo%3E%3Cmi%3E%26%23x3B1%3B%3C%2Fmi%3E%3Cmo%3E%3B%3C%2Fmo%3E%3Cmi%3Em%3C%2Fmi%3E%3Cmo%3E%2C%3C%2Fmo%3E%3Cmi%3En%3C%2Fmi%3E%3Cmo%3E)%3C%2Fmo%3E%3C%2Fmrow%3E%3C%2Fmsub%3E%3C%2Fmfrac%3E%3C%2Fmrow%3E%3C%2Fmfenced%3E%3Cmo%3E%3D%3C%2Fmo%3E%3Cmi%3E%26%23x3B1%3B%3C%2Fmi%3E%3Cmo%3E%26%23xA0%3B%3C%2Fmo%3E%3Cmspace%20linebreak%3D%22newline%22%2F%3E%3Cmi%3Ea%3C%2Fmi%3E%3Cmi%3El%3C%2Fmi%3E%3Cmi%3Es%3C%2Fmi%3E%3Cmi%3Eo%3C%2Fmi%3E%3Cmspace%20linebreak%3D%22newline%22%2F%3E%3Cmi%3EP%3C%2Fmi%3E%3Cmfenced%20close%3D%22%5D%22%20open%3D%22%5B%22%3E%3Cmrow%3E%3Cmo%3E%26%23xA0%3B%3C%2Fmo%3E%3Cmsub%3E%3Cmi%3EF%3C%2Fmi%3E%3Cmrow%3E%3Cmo%3E(%3C%2Fmo%3E%3Cmi%3En%3C%2Fmi%3E%3Cmo%3E%2C%3C%2Fmo%3E%3Cmi%3Em%3C%2Fmi%3E%3Cmo%3E)%3C%2Fmo%3E%3C%2Fmrow%3E%3C%2Fmsub%3E%3Cmo%3E%26%23x2264%3B%3C%2Fmo%3E%3Cmfrac%3E%3Cmn%3E1%3C%2Fmn%3E%3Cmsub%3E%3Cmi%3EF%3C%2Fmi%3E%3Cmrow%3E%3Cmo%3E(%3C%2Fmo%3E%3Cmi%3E%26%23x3B1%3B%3C%2Fmi%3E%3Cmo%3E%3B%3C%2Fmo%3E%3Cmi%3Em%3C%2Fmi%3E%3Cmo%3E%2C%3C%2Fmo%3E%3Cmi%3En%3C%2Fmi%3E%3Cmo%3E)%3C%2Fmo%3E%3C%2Fmrow%3E%3C%2Fmsub%3E%3C%2Fmfrac%3E%3C%2Fmrow%3E%3C%2Fmfenced%3E%3Cmo%3E%3D%3C%2Fmo%3E%3Cmn%3E1%3C%2Fmn%3E%3Cmo%3E-%3C%2Fmo%3E%3Cmi%3E%26%23x3B1%3B%3C%2Fmi%3E%3Cmo%3E%26%23xA0%3B%3C%2Fmo%3E%3Cmo%3E%26%23xA0%3B%3C%2Fmo%3E%3Cmo%3E%26%23xA0%3B%3C%2Fmo%3E%3Cmo%3E%26%23xA0%3B%3C%2Fmo%3E%3Cmo%3E%26%23xA0%3B%3C%2Fmo%3E%3Cmo%3E.%3C%2Fmo%3E%3Cmo%3E.%3C%2Fmo%3E%3Cmo%3E.%3C%2Fmo%3E%3Cmo%3E.%3C%2Fmo%3E%3Cmo%3E.%3C%2Fmo%3E%3Cmo%3E.%3C%2Fmo%3E%3Cmo%3E.%3C%2Fmo%3E%3Cmo%3E.%3C%2Fmo%3E%3Cmo%3E.%3C%2Fmo%3E%3Cmo%3E.%3C%2Fmo%3E%3Cmo%3E.%3C%2Fmo%3E%3Cmo%3E.%3C%2Fmo%3E%3Cmo%3E.%3C%2Fmo%3E%3Cmo%3E.%3C%2Fmo%3E%3Cmo%3E(%3C%2Fmo%3E%3Cmn%3E1%3C%2Fmn%3E%3Cmo%3E)%3C%2Fmo%3E%3Cmspace%20linebreak%3D%22newline%22%2F%3E%3Cmi%3EH%3C%2Fmi%3E%3Cmi%3Eo%3C%2Fmi%3E%3Cmi%3Ew%3C%2Fmi%3E%3Cmo%3E%26%23xA0%3B%3C%2Fmo%3E%3Cmi%3Ee%3C%2Fmi%3E%3Cmi%3Ev%3C%2Fmi%3E%3Cmi%3Ee%3C%2Fmi%3E%3Cmi%3Er%3C%2Fmi%3E%3Cmo%3E%26%23xA0%3B%3C%2Fmo%3E%3Cmi%3Eb%3C%2Fmi%3E%3Cmi%3Ey%3C%2Fmi%3E%3Cmo%3E%26%23xA0%3B%3C%2Fmo%3E%3Cmi%3Ed%3C%2Fmi%3E%3Cmi%3Ee%3C%2Fmi%3E%3Cmi%3Ef%3C%2Fmi%3E%3Cmi%3Ei%3C%2Fmi%3E%3Cmi%3En%3C%2Fmi%3E%3Cmi%3Ea%3C%2Fmi%3E%3Cmi%3Et%3C%2Fmi%3E%3Cmi%3Ei%3C%2Fmi%3E%3Cmi%3Eo%3C%2Fmi%3E%3Cmi%3En%3C%2Fmi%3E%3Cmspace%20linebreak%3D%22newline%22%2F%3E%3Cmi%3EP%3C%2Fmi%3E%3Cmfenced%20close%3D%22%5D%22%20open%3D%22%5B%22%3E%3Cmrow%3E%3Cmo%3E%26%23xA0%3B%3C%2Fmo%3E%3Cmsub%3E%3Cmi%3EF%3C%2Fmi%3E%3Cmrow%3E%3Cmo%3E(%3C%2Fmo%3E%3Cmi%3En%3C%2Fmi%3E%3Cmo%3E%2C%3C%2Fmo%3E%3Cmi%3Em%3C%2Fmi%3E%3Cmo%3E)%3C%2Fmo%3E%3C%2Fmrow%3E%3C%2Fmsub%3E%3Cmo%3E%26%23x2265%3B%3C%2Fmo%3E%3Cmsub%3E%3Cmi%3EF%3C%2Fmi%3E%3Cmrow%3E%3Cmo%3E(%3C%2Fmo%3E%3Cmn%3E1%3C%2Fmn%3E%3Cmo%3E-%3C%2Fmo%3E%3Cmi%3E%26%23x3B1%3B%3C%2Fmi%3E%3Cmo%3E%3B%3C%2Fmo%3E%3Cmi%3En%3C%2Fmi%3E%3Cmo%3E%2C%3C%2Fmo%3E%3Cmi%3Em%3C%2Fmi%3E%3Cmo%3E)%3C%2Fmo%3E%3C%2Fmrow%3E%3C%2Fmsub%3E%3C%2Fmrow%3E%3C%2Fmfenced%3E%3Cmo%3E%3D%3C%2Fmo%3E%3Cmn%3E1%3C%2Fmn%3E%3Cmo%3E-%3C%2Fmo%3E%3Cmi%3E%26%23x3B1%3B%3C%2Fmi%3E%3Cmo%3E%26%23xA0%3B%3C%2Fmo%3E%3Cmo%3E%26%23xA0%3B%3C%2Fmo%3E%3Cmo%3E%26%23xA0%3B%3C%2Fmo%3E%3Cmo%3E%26%23xA0%3B%3C%2Fmo%3E%3Cmo%3E%26%23xA0%3B%3C%2Fmo%3E%3Cmo%3E.%3C%2Fmo%3E%3Cmo%3E.%3C%2Fmo%3E%3Cmo%3E.%3C%2Fmo%3E%3Cmo%3E.%3C%2Fmo%3E%3Cmo%3E.%3C%2Fmo%3E%3Cmo%3E.%3C%2Fmo%3E%3Cmo%3E.%3C%2Fmo%3E%3Cmo%3E.%3C%2Fmo%3E%3Cmo%3E.%3C%2Fmo%3E%3Cmo%3E.%3C%2Fmo%3E%3Cmo%3E.%3C%2Fmo%3E%3Cmo%3E.%3C%2Fmo%3E%3Cmo%3E.%3C%2Fmo%3E%3Cmo%3E.%3C%2Fmo%3E%3Cmo%3E.%3C%2Fmo%3E%3Cmo%3E(%3C%2Fmo%3E%3Cmn%3E2%3C%2Fmn%3E%3Cmo%3E)%3C%2Fmo%3E%3Cmspace%20linebreak%3D%22newline%22%2F%3E%3Cmspace%20linebreak%3D%22newline%22%2F%3E%3Cmi%3EF%3C%2Fmi%3E%3Cmi%3Er%3C%2Fmi%3E%3Cmi%3Eo%3C%2Fmi%3E%3Cmi%3Em%3C%2Fmi%3E%3Cmo%3E%26%23xA0%3B%3C%2Fmo%3E%3Cmo%3E(%3C%2Fmo%3E%3Cmn%3E1%3C%2Fmn%3E%3Cmo%3E)%3C%2Fmo%3E%3Cmo%3E%26%23xA0%3B%3C%2Fmo%3E%3Cmi%3Ea%3C%2Fmi%3E%3Cmi%3En%3C%2Fmi%3E%3Cmi%3Ed%3C%2Fmi%3E%3Cmo%3E%26%23xA0%3B%3C%2Fmo%3E%3Cmo%3E(%3C%2Fmo%3E%3Cmn%3E2%3C%2Fmn%3E%3Cmo%3E)%3C%2Fmo%3E%3Cmo%3E%26%23xA0%3B%3C%2Fmo%3E%3Cmi%3Ew%3C%2Fmi%3E%3Cmi%3Ee%3C%2Fmi%3E%3Cmo%3E%26%23xA0%3B%3C%2Fmo%3E%3Cmi%3Eg%3C%2Fmi%3E%3Cmi%3Ee%3C%2Fmi%3E%3Cmi%3Et%3C%2Fmi%3E%3Cmspace%20linebreak%3D%22newline%22%2F%3E%3Cmfrac%3E%3Cmn%3E1%3C%2Fmn%3E%3Cmsub%3E%3Cmi%3EF%3C%2Fmi%3E%3Cmrow%3E%3Cmo%3E(%3C%2Fmo%3E%3Cmi%3E%26%23x3B1%3B%3C%2Fmi%3E%3Cmo%3E%3B%3C%2Fmo%3E%3Cmi%3Em%3C%2Fmi%3E%3Cmo%3E%2C%3C%2Fmo%3E%3Cmi%3En%3C%2Fmi%3E%3Cmo%3E)%3C%2Fmo%3E%3C%2Fmrow%3E%3C%2Fmsub%3E%3C%2Fmfrac%3E%3Cmo%3E%3D%3C%2Fmo%3E%3Cmsub%3E%3Cmi%3EF%3C%2Fmi%3E%3Cmrow%3E%3Cmo%3E(%3C%2Fmo%3E%3Cmn%3E1%3C%2Fmn%3E%3Cmo%3E-%3C%2Fmo%3E%3Cmi%3E%26%23x3B1%3B%3C%2Fmi%3E%3Cmo%3E%3B%3C%2Fmo%3E%3Cmi%3En%3C%2Fmi%3E%3Cmo%3E%2C%3C%2Fmo%3E%3Cmi%3Em%3C%2Fmi%3E%3Cmo%3E)%3C%2Fmo%3E%3C%2Fmrow%3E%3C%2Fmsub%3E%3Cmspace%20linebreak%3D%22newline%22%2F%3E%3Cmsub%3E%3Cmi%3EF%3C%2Fmi%3E%3Cmrow%3E%3Cmo%3E(%3C%2Fmo%3E%3Cmi%3E%26%23x3B1%3B%3C%2Fmi%3E%3Cmo%3E%3B%3C%2Fmo%3E%3Cmi%3Em%3C%2Fmi%3E%3Cmo%3E%2C%3C%2Fmo%3E%3Cmi%3En%3C%2Fmi%3E%3Cmo%3E)%3C%2Fmo%3E%3C%2Fmrow%3E%3C%2Fmsub%3E%3Cmo%3E%3D%3C%2Fmo%3E%3Cmfrac%3E%3Cmn%3E1%3C%2Fmn%3E%3Cmsub%3E%3Cmi%3EF%3C%2Fmi%3E%3Cmrow%3E%3Cmo%3E(%3C%2Fmo%3E%3Cmn%3E1%3C%2Fmn%3E%3Cmo%3E-%3C%2Fmo%3E%3Cmi%3E%26%23x3B1%3B%3C%2Fmi%3E%3Cmo%3E%3B%3C%2Fmo%3E%3Cmi%3En%3C%2Fmi%3E%3Cmo%3E%2C%3C%2Fmo%3E%3Cmi%3Em%3C%2Fmi%3E%3Cmo%3E)%3C%2Fmo%3E%3C%2Fmrow%3E%3C%2Fmsub%3E%3C%2Fmfrac%3E%3C%2Fmath%3E--%3E%3Cdefs%3E%3Cstyle%20type%3D%22text%2Fcss%22%3E%40font-face%7Bfont-family%3A'a9ae65dcc5ba03ef2f0f633c7df668a'%3Bsrc%3Aurl(data%3Afont%2Ftruetype%3Bcharset%3Dutf-8%3Bbase64%2CAAEAAAAMAIAAAwBAT1MvMjv%2FLJYAAADMAAAATmNtYXDgWxEdAAABHAAAADxjdnQgAAAABwAAAVgAAAAEZ2x5ZoYrxVAAAAFcAAABW2hlYWQOdyayAAACuAAAADZoaGVhC0UVwQAAAvAAAAAkaG10eCg8AIUAAAMUAAAADGxvY2EAAAVKAAADIAAAABBtYXhwBIoEWwAAAzAAAAAgbmFtZXSF9ZsAAANQAAABrXBvc3QDogHPAAAFAAAAACBwcmVwukanGAAABSAAAAANAAAGtAGQAAUAAAgACAAAAAAACAAIAAAAAAAAAQIAAAAAAAAAAAAAAAAAAAAAAAAAAAAAAAAAAAAAACAgICAAAAAg8AMGe%2F57AAAHPgGyAAAAAAACAAEAAQAAABQAAwABAAAAFAAEACgAAAAGAAQAAQACAGEAZv%2F%2FAAAAYQBm%2F%2F%2F%2FoP%2BcAAEAAAAAAAAAAAAHAAIAVQAAAwADqwADAAcAADMRIRElIREhVQKr%2FasCAP4AA6v8VVUDAAADAC3%2FdAQDBFkACwAXAB0AOxgBsB0QsAPUsAMQsBTUsBQQsBzUsBwQsAnUsBwQsA48sAkQsBs8ALAGELAR1LAGELAA1LAAELAX1DAxASIAERYSMzISNxAmBhYDAgYjIiY1NDYzATUGEyMSAgGz%2Ft8W9bLTugOFhnAWDE6FWbKyhQHtjASyUQRZ%2Ft%2F%2B3vX%2B3wEz4wGnnLIt%2Fp3%2FAGXInN%2By%2FFmMXQHn%2FV4AAQAB%2FvUC9QZDABoANRgBsBsQsAjUsAgQsAHUsBsQsAzUsAwQsBjUALAbELAK1LAKELAL1LAbELAA1LAAELAY1DAxAREQIyInNRY3ESM3FzUQITIXFSYjIgYdASEVAWXfWSyxAYYDgwFkWYVZWVmFAQsDp%2FxZ%2FvUshlmyA6eHAYUBkVmGWVmyhYYAAAEAAAABAACav9usXw889QADCAD%2F%2F%2F%2F%2F1a3uPf%2F%2F%2F%2F%2FVre49AAH%2B9QQDBkMAAAAKAAIAAQAAAAAAAQAABz7%2BTgAAF3AAAf%2F8BAMAAQAAAAAAAAAAAAAAAAAAAAMDUgBVBEwALQLxAAEAAAAAAAAAKAAAANEAAAFbAAEAAAADAB4AAwAAAAAAAgCABAAAAAAABAAAOwAAAAAAAAAVAQIAAAAAAAAAAQAWAAAAAAAAAAAAAgAOABYAAAAAAAAAAwA0ACQAAAAAAAAABAAWAFgAAAAAAAAABQAWAG4AAAAAAAAABgALAIQAAAAAAAAACAAcAI8AAQAAAAAAAQAWAAAAAQAAAAAAAgAOABYAAQAAAAAAAwA0ACQAAQAAAAAABAAWAFgAAQAAAAAABQAWAG4AAQAAAAAABgALAIQAAQAAAAAACAAcAI8AAwABBAkAAQAWAAAAAwABBAkAAgAOABYAAwABBAkAAwA0ACQAAwABBAkABAAWAFgAAwABBAkABQAWAG4AAwABBAkABgALAIQAAwABBAkACAAcAI8ATQBhAHQAaAAgAEYAbwBuAHQAIAAyAFIAZQBnAHUAbABhAHIATQBhAHQAaABzACAARgBvAHIAIABNAG8AcgBlACAATQBhAHQAaAAgAEYAbwBuAHQAIAAyAE0AYQB0AGgAIABGAG8AbgB0ACAAMgBWAGUAcgBzAGkAbwBuACAAMQAuADBNYXRoX0ZvbnRfMgBNAGEAdABoAHMAIABGAG8AcgAgAE0AbwByAGUAAAAAAwAAAAAAAAOfAc8AAAAAAAAAAAAAAAAAAAAAAAAAALkHIgAAjYUYALIAAAAAAAA%3D)format('truetype')%3Bfont-weight%3Anormal%3Bfont-style%3Anormal%3B%7D%40font-face%7Bfont-family%3A'math1c844e7b6f4c32a117bd5437956'%3Bsrc%3Aurl(data%3Afont%2Ftruetype%3Bcharset%3Dutf-8%3Bbase64%2CAAEAAAAMAIAAAwBAT1MvMi7iBBMAAADMAAAATmNtYXDEvmKUAAABHAAAAGRjdnQgDVUNBwAAAYAAAAA6Z2x5ZoPi2VsAAAG8AAACcmhlYWQQC2qxAAAEMAAAADZoaGVhCGsXSAAABGgAAAAkaG10eE2rRkcAAASMAAAAIGxvY2EAHTwYAAAErAAAACRtYXhwBT0FPgAABNAAAAAgbmFtZaBxlY4AAATwAAABn3Bvc3QB9wD6AAAGkAAAACBwcmVwa1uragAABrAAAAAUAAADSwGQAAUAAAQABAAAAAAABAAEAAAAAAAAAQEAAAAAAAAAAAAAAAAAAAAAAAAAAAAAAAAAAAAAACAgICAAAAAg1UADev96AAAD6ACWAAAAAAACAAEAAQAAABQAAwABAAAAFAAEAFAAAAAQABAAAwAAACwALgA7AD0iEiJkImX%2F%2FwAAACwALgA7AD0iEiJkImX%2F%2F%2F%2FV%2F9T%2FyP%2FH3fPdot2iAAEAAAAAAAAAAAAAAAAAAAAAAAABVAMsAIABAABWACoCWAIeAQ4BLAIsAFoBgAKAAKAA1ACAAAAAAAAAACsAVQCAAKsA1QEAASsABwAAAAIAVQAAAwADqwADAAcAADMRIRElIREhVQKr%2FasCAP4AA6v8VVUDAAABAFX%2FZADVAIAACgAAMzUzFRQGByc%2BATdVgC8vGx4eAYB6PVEUKQ40MQABACAAAACgAIAAAwAvGAGwBBCwA9SwAxCwAtSwAxCwADywAhCwATwAsAQQsAPUsAMQsAI8sAAQsAE8MDE3MxUjIICAgIAAAgBV%2F2QA1QIAAAoADgAAMzUzFRQGByc%2BATcDMzUjVYAvLxseHgFEgICAej1RFCkONDEBgIAAAgCAAOsC1QIVAAMABwBlGAGwCBCwBtSwBhCwBdSwCBCwAdSwARCwANSwBhCwBzywBRCwBDywARCwAjywABCwAzwAsAgQsAbUsAYQsAfUsAcQsAHUsAEQsALUsAYQsAU8sAcQsAQ8sAEQsAA8sAIQsAM8MTATITUhHQEhNYACVf2rAlUBwFXVVVUAAQCAAVUC1QGrAAMAMBgBsAQQsQAD9rADPLECB%2FWwATyxBQPmALEAABMQsQAG5bEAARMQsAE8sQMF9bACPBMhFSGAAlX9qwGrVgADAID%2FqwKAAqsAAwAHAAsALxgBALEJAD%2BxCAXksQIF9LEBBPSxBgX0sQME5LEFBPSxBAX0sQcBEDyxAAYQPDAxEwcBNRM1ARcBNSEVgQEB%2FwH%2BAAEB%2F%2F4AAatW%2FwBWAapW%2FwBW%2FlZVVQADAID%2FqwKBAqsAAwAHAAsALxgBALEJAD%2BxCAXksQIF9LEBBPSxBgX0sQME5LEFBPSxBAX0sQcBEDyxAAYQPDAxARUBNRE1ARUBNSEVAoD%2BAAIB%2Ff8CAAGrVv8AVgGqVv8AVv5WVVUAAAABAAAAAQAA1XjOQV8PPPUAAwQA%2F%2F%2F%2F%2F9Y6E3P%2F%2F%2F%2F%2F1joTcwAA%2FyAEgAOrAAAACgACAAEAAAAAAAEAAAPo%2F2oAABdwAAD%2FtgSAAAEAAAAAAAAAAAAAAAAAAAAIA1IAVQEzAFUAyAAgAQQAVQNWAIADVgCAAwAAgAMAAIAAAAAAAAAAKAAAAFIAAACYAAAAzgAAAVgAAAGiAAACCwAAAnIAAQAAAAgAXgAFAAAAAAACAIAEAAAAAAAEAADeAAAAAAAAABUBAgAAAAAAAAABABIAAAAAAAAAAAACAA4AEgAAAAAAAAADADAAIAAAAAAAAAAEABIAUAAAAAAAAAAFABYAYgAAAAAAAAAGAAkAeAAAAAAAAAAIABwAgQABAAAAAAABABIAAAABAAAAAAACAA4AEgABAAAAAAADADAAIAABAAAAAAAEABIAUAABAAAAAAAFABYAYgABAAAAAAAGAAkAeAABAAAAAAAIABwAgQADAAEECQABABIAAAADAAEECQACAA4AEgADAAEECQADADAAIAADAAEECQAEABIAUAADAAEECQAFABYAYgADAAEECQAGAAkAeAADAAEECQAIABwAgQBNAGEAdABoACAARgBvAG4AdABSAGUAZwB1AGwAYQByAE0AYQB0AGgAcwAgAEYAbwByACAATQBvAHIAZQAgAE0AYQB0AGgAIABGAG8AbgB0AE0AYQB0AGgAIABGAG8AbgB0AFYAZQByAHMAaQBvAG4AIAAxAC4AME1hdGhfRm9udABNAGEAdABoAHMAIABGAG8AcgAgAE0AbwByAGUAAAMAAAAAAAAB9AD6AAAAAAAAAAAAAAAAAAAAAAAAAAC5BxEAAI2FGACyAAAAFRQTsQABPw%3D%3D)format('truetype')%3Bfont-weight%3Anormal%3Bfont-style%3Anormal%3B%7D%40font-face%7Bfont-family%3A'brack_sm4e06b854ad106cdec1d8cc9'%3Bsrc%3Aurl(data%3Afont%2Ftruetype%3Bcharset%3Dutf-8%3Bbase64%2CAAEAAAAMAIAAAwBAT1MvMi7PH4UAAADMAAAATmNtYXA3kjw6AAABHAAAAFxjdnQgAQYDiAAAAXgAAAASZ2x5ZkyYQ7YAAAGMAAABqmhlYWQLyR8fAAADOAAAADZoaGVhAq0XCAAAA3AAAAAkaG10eDEjA%2FUAAAOUAAAAHGxvY2EAAEKZAAADsAAAACBtYXhwBJsEcQAAA9AAAAAgbmFtZW7QvZAAAAPwAAAB5XBvc3QArQBVAAAF2AAAACBwcmVwu5WEAAAABfgAAAAHAAACDAGQAAUAAAQABAAAAAAABAAEAAAAAAAAAQEAAAAAAAAAAAAAAAAAAAAAAAAAAAAAAAAAAAAAACAgICAAAAAg9AMD%2FP%2F8AAABVAABAAAAAAACAAEAAQAAABQAAwABAAAAFAAEAEgAAAAOAAgAAgAGI6EjoiOjI6QjpSOm%2F%2F8AACOhI6IjoyOkI6Ujpv%2F%2F3GDcYNxg3GDcYNxgAAEAAAAAAAAAAAAAAAAAAAAAAVQAVAEAACsAjACAAKgABwAAAAIAAAAAANUBAQADAAcAADEzESMXIzUz1dWrgIABAdarAAEAAAAAAQABVAAFACkYAbAGELAA1LAAELAF1LAFELAD1ACwBhCwANSwABCwA9SwAxCwAdQwMTERIRUjFQEAqwFUVf8AAQAAAAAAVQFUAAMAIRgBsAEvsQcCPDyxAwL1sAA8ALEDAD%2BwAjx8sQAG9bABPBEzESNVVQFU%2FqwAAQAAAAABAAFUAAUAKRgBsAYQsADUsAAQsAXUsAUQsAPUALAGELAA1LAAELAD1LADELAB1DAxGQEhNSM1AQCrAVT%2BrFX%2FAAEAAAAAAQABVAAFACkYAbAGELAB1LABELAA1LAAELAE1ACwBhCwAdSwARCwBNSwBBCwAtQwMTsBESEVM6tV%2FwCrAVRVAAEAqgAAAQABVAADACEYAbABL7EHAjw8sQMC9bAAPACxAwA%2FsAI8fLEABvWwATwTMxEjqlZWAVT%2BrAABAAAAAAEAAVQABQApGAGwBhCwAdSwARCwANSwABCwBNQAsAYQsAHUsAEQsATUsAQQsALUMDETMxEhNTOrVf8AqwFU%2FqxVAAAAAQAAAAEAAIsesexfDzz1AAMEAP%2F%2F%2F%2F%2FVre5k%2F%2F%2F%2F%2F9Wt7mT%2FgP%2F%2FAdYBWAAAAAoAAgABAAAAAAABAAABVP%2F%2FAAAXcP%2BA%2F4AB1gABAAAAAAAAAAAAAAAAAAAABwDVAAABAAAAAQAAAAEAAAABAAAAAQAAqgEAAAAAAAAAAAAAIQAAAGUAAACeAAAA5AAAASkAAAFjAAABqgABAAAABwAKAAIAAAAAAAIAgAQAAAAAAAQAAGUAAAAAAAAAFQECAAAAAAAAAAEAJgAAAAAAAAAAAAIADgAmAAAAAAAAAAMARAA0AAAAAAAAAAQAJgB4AAAAAAAAAAUAFgCeAAAAAAAAAAYAEwC0AAAAAAAAAAgAHADHAAEAAAAAAAEAJgAAAAEAAAAAAAIADgAmAAEAAAAAAAMARAA0AAEAAAAAAAQAJgB4AAEAAAAAAAUAFgCeAAEAAAAAAAYAEwC0AAEAAAAAAAgAHADHAAMAAQQJAAEAJgAAAAMAAQQJAAIADgAmAAMAAQQJAAMARAA0AAMAAQQJAAQAJgB4AAMAAQQJAAUAFgCeAAMAAQQJAAYAEwC0AAMAAQQJAAgAHADHAEIAcgBhAGMAawBlAHQAcwAgAHMAbQBhAGwAbAAgAHMAaQB6AGUAUgBlAGcAdQBsAGEAcgBNAGEAdABoAHMAIABGAG8AcgAgAE0AbwByAGUAIABCAHIAYQBjAGsAZQB0AHMAIABzAG0AYQBsAGwAIABzAGkAegBlAEIAcgBhAGMAawBlAHQAcwAgAHMAbQBhAGwAbAAgAHMAaQB6AGUAVgBlAHIAcwBpAG8AbgAgADIALgAwQnJhY2tldHNfc21hbGxfc2l6ZQBNAGEAdABoAHMAIABGAG8AcgAgAE0AbwByAGUAAAAAAwAAAAAAAACqAFUAAAAAAAAAAAAAAAAAAAAAAAAAALkH%2FwACjYUA)format('truetype')%3Bfont-weight%3Anormal%3Bfont-style%3Anormal%3B%7D%40font-face%7Bfont-family%3A'round_brackets18549f92a457f2409'%3Bsrc%3Aurl(data%3Afont%2Ftruetype%3Bcharset%3Dutf-8%3Bbase64%2CAAEAAAAMAIAAAwBAT1MvMjwHLFQAAADMAAAATmNtYXDf7xCrAAABHAAAADxjdnQgBAkDLgAAAVgAAAASZ2x5ZmAOz2cAAAFsAAABJGhlYWQOKih8AAACkAAAADZoaGVhCvgVwgAAAsgAAAAkaG10eCA6AAIAAALsAAAADGxvY2EAAARLAAAC%2BAAAABBtYXhwBIgEWQAAAwgAAAAgbmFtZXHR30MAAAMoAAACOXBvc3QDogHPAAAFZAAAACBwcmVwupWEAAAABYQAAAAHAAAGcgGQAAUAAAgACAAAAAAACAAIAAAAAAAAAQIAAAAAAAAAAAAAAAAAAAAAAAAAAAAAAAAAAAAAACAgICAAAAAo8AMGe%2F57AAAHPgGyAAAAAAACAAEAAQAAABQAAwABAAAAFAAEACgAAAAGAAQAAQACACgAKf%2F%2FAAAAKAAp%2F%2F%2F%2F2f%2FZAAEAAAAAAAAAAAFUAFYBAAAsAKgDgAAyAAcAAAACAAAAKgDVA1UAAwAHAAA1MxEjEyMRM9XVq4CAKgMr%2FQAC1QABAAD%2B0AIgBtAACQBNGAGwChCwA9SwAxCwAtSwChCwBdSwBRCwANSwAxCwBzywAhCwCDwAsAoQsAPUsAMQsAfUsAoQsAXUsAoQsADUsAMQsAI8sAcQsAg8MTAREAEzABEQASMAAZCQ%2FnABkJD%2BcALQ%2FZD%2BcAGQAnACcAGQ%2FnAAAQAA%2FtACIAbQAAkATRgBsAoQsAPUsAMQsALUsAoQsAXUsAUQsADUsAMQsAc8sAIQsAg8ALAKELAD1LADELAH1LAKELAF1LAKELAA1LADELACPLAHELAIPDEwARABIwAREAEzAAIg%2FnCQAZD%2BcJABkALQ%2FZD%2BcAGQAnACcAGQ%2FnAAAQAAAAEAAPW2NYFfDzz1AAMIAP%2F%2F%2F%2F%2FVre7u%2F%2F%2F%2F%2F9Wt7u4AAP7QA7cG0AAAAAoAAgABAAAAAAABAAAHPv5OAAAXcAAA%2F%2F4DtwABAAAAAAAAAAAAAAAAAAAAAwDVAAACIAAAAiAAAAAAAAAAAAAkAAAAowAAASQAAQAAAAMACgACAAAAAAACAIAEAAAAAAAEAABNAAAAAAAAABUBAgAAAAAAAAABAD4AAAAAAAAAAAACAA4APgAAAAAAAAADAFwATAAAAAAAAAAEAD4AqAAAAAAAAAAFABYA5gAAAAAAAAAGAB8A%2FAAAAAAAAAAIABwBGwABAAAAAAABAD4AAAABAAAAAAACAA4APgABAAAAAAADAFwATAABAAAAAAAEAD4AqAABAAAAAAAFABYA5gABAAAAAAAGAB8A%2FAABAAAAAAAIABwBGwADAAEECQABAD4AAAADAAEECQACAA4APgADAAEECQADAFwATAADAAEECQAEAD4AqAADAAEECQAFABYA5gADAAEECQAGAB8A%2FAADAAEECQAIABwBGwBSAG8AdQBuAGQAIABiAHIAYQBjAGsAZQB0AHMAIAB3AGkAdABoACAAYQBzAGMAZQBuAHQAIAAxADgANQA0AFIAZQBnAHUAbABhAHIATQBhAHQAaABzACAARgBvAHIAIABNAG8AcgBlACAAUgBvAHUAbgBkACAAYgByAGEAYwBrAGUAdABzACAAdwBpAHQAaAAgAGEAcwBjAGUAbgB0ACAAMQA4ADUANABSAG8AdQBuAGQAIABiAHIAYQBjAGsAZQB0AHMAIAB3AGkAdABoACAAYQBzAGMAZQBuAHQAIAAxADgANQA0AFYAZQByAHMAaQBvAG4AIAAyAC4AMFJvdW5kX2JyYWNrZXRzX3dpdGhfYXNjZW50XzE4NTQATQBhAHQAaABzACAARgBvAHIAIABNAG8AcgBlAAAAAAMAAAAAAAADnwHPAAAAAAAAAAAAAAAAAAAAAAAAAAC5B%2F8AAY2FAA%3D%3D)format('truetype')%3Bfont-weight%3Anormal%3Bfont-style%3Anormal%3B%7D%40font-face%7Bfont-family%3A'brackets4e06b854ad106cdec1d8cc9'%3Bsrc%3Aurl(data%3Afont%2Ftruetype%3Bcharset%3Dutf-8%3Bbase64%2CAAEAAAAMAIAAAwBAT1MvMi7RIisAAADMAAAATmNtYXBi7uzYAAABHAAAAFxjdnQgBAkDLgAAAXgAAAASZ2x5Zo64f%2BkAAAGMAAABi2hlYWQLniGcAAADGAAAADZoaGVhBK4XLAAAA1AAAAAkaG10eCWq%2F90AAAN0AAAAHGxvY2EAABknAAADkAAAACBtYXhwBJIESAAAA7AAAAAgbmFtZRAA8I4AAAPQAAAB3nBvc3QBwwDgAAAFsAAAACBwcmVwupWEAAAABdAAAAAHAAACggGQAAUAAAQABAAAAAAABAAEAAAAAAAAAQEAAAAAAAAAAAAAAAAAAAAAAAAAAAAAAAAAAAAAACAgICAAAAAg9AMEAAAAAAADgAAAAAAAAAACAAEAAQAAABQAAwABAAAAFAAEAEgAAAAOAAgAAgAGI6EjoiOjI6QjpSOm%2F%2F8AACOhI6IjoyOkI6Ujpv%2F%2F3GDcYNxg3GDcYNxgAAEAAAAAAAAAAAAAAAAAAAAAAVQAVgEAACwAqAOAADIABwAAAAIAAAAqANUDVQADAAcAADUzESMTIxEz1dWrgIAqAyv9AALVAAEAAAAAAVUDgAAFAB8YAbEAAD%2BwBjyxBAL9sALFALEAAD%2BxAgY%2FsQQC7TEwMREhFSERAVX%2FAAOAVfzVAAEAAAAAAFUDgAADAB8YAbADL7AAPLECAvWwATwAsQMAP7ACPHyxAAb1sAE8ETMRI1VVA4D8gAABAAAAAAFVA4AABQAhGAGxAAA%2FsAY8sQQC%2FbACxQB8sQAGPxixAgb2sQQC7TEwGQEhNSERAVX%2FAAOA%2FIBVAysAAf%2FXAAABLAOAAAUAHhgBsAEvsAc8sQUC%2FbADxQCxAQA%2FsQMGP7EFAu0xMDsBESEVIddV%2FqsBAAOAVQABANcAAAEsA4AAAwAhGAGwAS%2BxBwI8PLEDAvWwADwAsQMAP7ACPHyxAAb1sAE8EzMRI9dVVQOA%2FIAAAf%2FXAAABLAOAAAUAIBgBsAEvsAc8sQUC%2FbADxQB8sQEGPxixAwb2sQUC7TEwEzMRITUh11X%2BqwEAA4D8gFUAAAEAAAABAAB65NymXw889QADBAD%2F%2F%2F%2F%2F1a3ujv%2F%2F%2F%2F%2FVre6O%2F6wAAAGAA4AAAAAKAAIAAQAAAAAAAQAAA4AAAAAAF3D%2FrP%2BsAYAAAQAAAAAAAAAAAAAAAAAAAAcA1QAAASwAAAEsAAABLAAAASz%2F1wEsANcBLP%2FXAAAAAAAAACQAAABgAAAAlwAAANcAAAESAAABTAAAAYsAAQAAAAcACAACAAAAAAACAIAEAAAAAAAEAAA%2BAAAAAAAAABUBAgAAAAAAAAABACQAAAAAAAAAAAACAA4AJAAAAAAAAAADAEIAMgAAAAAAAAAEACQAdAAAAAAAAAAFABYAmAAAAAAAAAAGABIArgAAAAAAAAAIABwAwAABAAAAAAABACQAAAABAAAAAAACAA4AJAABAAAAAAADAEIAMgABAAAAAAAEACQAdAABAAAAAAAFABYAmAABAAAAAAAGABIArgABAAAAAAAIABwAwAADAAEECQABACQAAAADAAEECQACAA4AJAADAAEECQADAEIAMgADAAEECQAEACQAdAADAAEECQAFABYAmAADAAEECQAGABIArgADAAEECQAIABwAwABCAHIAYQBjAGsAZQB0AHMAIABmAHUAbABsACAAcwBpAHoAZQBSAGUAZwB1AGwAYQByAE0AYQB0AGgAcwAgAEYAbwByACAATQBvAHIAZQAgAEIAcgBhAGMAawBlAHQAcwAgAGYAdQBsAGwAIABzAGkAegBlAEIAcgBhAGMAawBlAHQAcwAgAGYAdQBsAGwAIABzAGkAegBlAFYAZQByAHMAaQBvAG4AIAAyAC4AMEJyYWNrZXRzX2Z1bGxfc2l6ZQBNAGEAdABoAHMAIABGAG8AcgAgAE0AbwByAGUAAAADAAAAAAAAAcAA4AAAAAAAAAAAAAAAAAAAAAAAAAAAuQf%2FAAGNhQA%3D)format('truetype')%3Bfont-weight%3Anormal%3Bfont-style%3Anormal%3B%7D%3C%2Fstyle%3E%3C%2Fdefs%3E%3Ctext%20font-family%3D%22Arial%22%20font-size%3D%2216%22%20font-style%3D%22italic%22%20text-anchor%3D%22middle%22%20x%3D%222.5%22%20y%3D%2216%22%3EI%3C%2Ftext%3E%3Ctext%20font-family%3D%22a9ae65dcc5ba03ef2f0f633c7df668a%22%20font-size%3D%2216%22%20font-style%3D%22italic%22%20text-anchor%3D%22middle%22%20x%3D%227.5%22%20y%3D%2216%22%3Ef%3C%2Ftext%3E%3Ctext%20font-family%3D%22Arial%22%20font-size%3D%2216%22%20font-style%3D%22italic%22%20text-anchor%3D%22middle%22%20x%3D%2222.5%22%20y%3D%2216%22%3EF%3C%2Ftext%3E%3Ctext%20font-family%3D%22Arial%22%20font-size%3D%2212%22%20font-style%3D%22italic%22%20text-anchor%3D%22middle%22%20x%3D%2231.5%22%20y%3D%2222%22%3E%26%23x3B1%3B%3C%2Ftext%3E%3Ctext%20font-family%3D%22math1c844e7b6f4c32a117bd5437956%22%20font-size%3D%2212%22%20text-anchor%3D%22middle%22%20x%3D%2237.5%22%20y%3D%2222%22%3E%3B%3C%2Ftext%3E%3Ctext%20font-family%3D%22Arial%22%20font-size%3D%2212%22%20font-style%3D%22italic%22%20text-anchor%3D%22middle%22%20x%3D%2245.5%22%20y%3D%2222%22%3Em%3C%2Ftext%3E%3Ctext%20font-family%3D%22math1c844e7b6f4c32a117bd5437956%22%20font-size%3D%2212%22%20text-anchor%3D%22middle%22%20x%3D%2253.5%22%20y%3D%2222%22%3E%2C%3C%2Ftext%3E%3Ctext%20font-family%3D%22Arial%22%20font-size%3D%2212%22%20font-style%3D%22italic%22%20text-anchor%3D%22middle%22%20x%3D%2258.5%22%20y%3D%2222%22%3En%3C%2Ftext%3E%3Ctext%20font-family%3D%22Arial%22%20font-size%3D%2216%22%20font-style%3D%22italic%22%20text-anchor%3D%22middle%22%20x%3D%2269.5%22%20y%3D%2216%22%3Ei%3C%2Ftext%3E%3Ctext%20font-family%3D%22Arial%22%20font-size%3D%2216%22%20font-style%3D%22italic%22%20text-anchor%3D%22middle%22%20x%3D%2275.5%22%20y%3D%2216%22%3Es%3C%2Ftext%3E%3Ctext%20font-family%3D%22a9ae65dcc5ba03ef2f0f633c7df668a%22%20font-size%3D%2216%22%20font-style%3D%22italic%22%20text-anchor%3D%22middle%22%20x%3D%2288.5%22%20y%3D%2216%22%3Ea%3C%2Ftext%3E%3Ctext%20font-family%3D%22Arial%22%20font-size%3D%2216%22%20font-style%3D%22italic%22%20text-anchor%3D%22middle%22%20x%3D%22102.5%22%20y%3D%2216%22%3Ep%3C%2Ftext%3E%3Ctext%20font-family%3D%22Arial%22%20font-size%3D%2216%22%20font-style%3D%22italic%22%20text-anchor%3D%22middle%22%20x%3D%22111.5%22%20y%3D%2216%22%3Eo%3C%2Ftext%3E%3Ctext%20font-family%3D%22Arial%22%20font-size%3D%2216%22%20font-style%3D%22italic%22%20text-anchor%3D%22middle%22%20x%3D%22118.5%22%20y%3D%2216%22%3Ei%3C%2Ftext%3E%3Ctext%20font-family%3D%22Arial%22%20font-size%3D%2216%22%20font-style%3D%22italic%22%20text-anchor%3D%22middle%22%20x%3D%22124.5%22%20y%3D%2216%22%3En%3C%2Ftext%3E%3Ctext%20font-family%3D%22Arial%22%20font-size%3D%2216%22%20font-style%3D%22italic%22%20text-anchor%3D%22middle%22%20x%3D%22131.5%22%20y%3D%2216%22%3Et%3C%2Ftext%3E%3Ctext%20font-family%3D%22Arial%22%20font-size%3D%2216%22%20font-style%3D%22italic%22%20text-anchor%3D%22middle%22%20x%3D%22142.5%22%20y%3D%2216%22%3Es%3C%2Ftext%3E%3Ctext%20font-family%3D%22Arial%22%20font-size%3D%2216%22%20font-style%3D%22italic%22%20text-anchor%3D%22middle%22%20x%3D%22150.5%22%20y%3D%2216%22%3Eu%3C%2Ftext%3E%3Ctext%20font-family%3D%22Arial%22%20font-size%3D%2216%22%20font-style%3D%22italic%22%20text-anchor%3D%22middle%22%20x%3D%22159.5%22%20y%3D%2216%22%3Ec%3C%2Ftext%3E%3Ctext%20font-family%3D%22Arial%22%20font-size%3D%2216%22%20font-style%3D%22italic%22%20text-anchor%3D%22middle%22%20x%3D%22167.5%22%20y%3D%2216%22%3Eh%3C%2Ftext%3E%3Ctext%20font-family%3D%22Arial%22%20font-size%3D%2216%22%20font-style%3D%22italic%22%20text-anchor%3D%22middle%22%20x%3D%22179.5%22%20y%3D%2216%22%3Et%3C%2Ftext%3E%3Ctext%20font-family%3D%22Arial%22%20font-size%3D%2216%22%20font-style%3D%22italic%22%20text-anchor%3D%22middle%22%20x%3D%22185.5%22%20y%3D%2216%22%3Eh%3C%2Ftext%3E%3Ctext%20font-family%3D%22a9ae65dcc5ba03ef2f0f633c7df668a%22%20font-size%3D%2216%22%20font-style%3D%22italic%22%20text-anchor%3D%22middle%22%20x%3D%22194.5%22%20y%3D%2216%22%3Ea%3C%2Ftext%3E%3Ctext%20font-family%3D%22Arial%22%20font-size%3D%2216%22%20font-style%3D%22italic%22%20text-anchor%3D%22middle%22%20x%3D%22201.5%22%20y%3D%2216%22%3Et%3C%2Ftext%3E%3Ctext%20font-family%3D%22Arial%22%20font-size%3D%2216%22%20font-style%3D%22italic%22%20text-anchor%3D%22middle%22%20x%3D%225.5%22%20y%3D%2246%22%3EP%3C%2Ftext%3E%3Ctext%20font-family%3D%22Arial%22%20font-size%3D%2216%22%20text-anchor%3D%22middle%22%20x%3D%2214.5%22%20y%3D%2246%22%3E%5B%3C%2Ftext%3E%3Ctext%20font-family%3D%22Arial%22%20font-size%3D%2216%22%20font-style%3D%22italic%22%20text-anchor%3D%22middle%22%20x%3D%2225.5%22%20y%3D%2246%22%3EF%3C%2Ftext%3E%3Ctext%20font-family%3D%22round_brackets18549f92a457f2409%22%20font-size%3D%2212%22%20text-anchor%3D%22middle%22%20x%3D%2233.5%22%20y%3D%2252%22%3E(%3C%2Ftext%3E%3Ctext%20font-family%3D%22Arial%22%20font-size%3D%2212%22%20font-style%3D%22italic%22%20text-anchor%3D%22middle%22%20x%3D%2240.5%22%20y%3D%2252%22%3Em%3C%2Ftext%3E%3Ctext%20font-family%3D%22math1c844e7b6f4c32a117bd5437956%22%20font-size%3D%2212%22%20text-anchor%3D%22middle%22%20x%3D%2248.5%22%20y%3D%2252%22%3E%2C%3C%2Ftext%3E%3Ctext%20font-family%3D%22Arial%22%20font-size%3D%2212%22%20font-style%3D%22italic%22%20text-anchor%3D%22middle%22%20x%3D%2253.5%22%20y%3D%2252%22%3En%3C%2Ftext%3E%3Ctext%20font-family%3D%22round_brackets18549f92a457f2409%22%20font-size%3D%2212%22%20text-anchor%3D%22middle%22%20x%3D%2259.5%22%20y%3D%2252%22%3E)%3C%2Ftext%3E%3Ctext%20font-family%3D%22math1c844e7b6f4c32a117bd5437956%22%20font-size%3D%2216%22%20text-anchor%3D%22middle%22%20x%3D%2270.5%22%20y%3D%2246%22%3E%26%23x2265%3B%3C%2Ftext%3E%3Ctext%20font-family%3D%22Arial%22%20font-size%3D%2216%22%20font-style%3D%22italic%22%20text-anchor%3D%22middle%22%20x%3D%2283.5%22%20y%3D%2246%22%3EF%3C%2Ftext%3E%3Ctext%20font-family%3D%22round_brackets18549f92a457f2409%22%20font-size%3D%2212%22%20text-anchor%3D%22middle%22%20x%3D%2291.5%22%20y%3D%2252%22%3E(%3C%2Ftext%3E%3Ctext%20font-family%3D%22Arial%22%20font-size%3D%2212%22%20font-style%3D%22italic%22%20text-anchor%3D%22middle%22%20x%3D%2296.5%22%20y%3D%2252%22%3E%26%23x3B1%3B%3C%2Ftext%3E%3Ctext%20font-family%3D%22math1c844e7b6f4c32a117bd5437956%22%20font-size%3D%2212%22%20text-anchor%3D%22middle%22%20x%3D%22102.5%22%20y%3D%2252%22%3E%3B%3C%2Ftext%3E%3Ctext%20font-family%3D%22Arial%22%20font-size%3D%2212%22%20font-style%3D%22italic%22%20text-anchor%3D%22middle%22%20x%3D%22110.5%22%20y%3D%2252%22%3Em%3C%2Ftext%3E%3Ctext%20font-family%3D%22math1c844e7b6f4c32a117bd5437956%22%20font-size%3D%2212%22%20text-anchor%3D%22middle%22%20x%3D%22118.5%22%20y%3D%2252%22%3E%2C%3C%2Ftext%3E%3Ctext%20font-family%3D%22Arial%22%20font-size%3D%2212%22%20font-style%3D%22italic%22%20text-anchor%3D%22middle%22%20x%3D%22123.5%22%20y%3D%2252%22%3En%3C%2Ftext%3E%3Ctext%20font-family%3D%22round_brackets18549f92a457f2409%22%20font-size%3D%2212%22%20text-anchor%3D%22middle%22%20x%3D%22129.5%22%20y%3D%2252%22%3E)%3C%2Ftext%3E%3Ctext%20font-family%3D%22Arial%22%20font-size%3D%2216%22%20text-anchor%3D%22middle%22%20x%3D%22134.5%22%20y%3D%2246%22%3E%5D%3C%2Ftext%3E%3Ctext%20font-family%3D%22math1c844e7b6f4c32a117bd5437956%22%20font-size%3D%2216%22%20text-anchor%3D%22middle%22%20x%3D%22144.5%22%20y%3D%2246%22%3E%3D%3C%2Ftext%3E%3Ctext%20font-family%3D%22Arial%22%20font-size%3D%2216%22%20font-style%3D%22italic%22%20text-anchor%3D%22middle%22%20x%3D%22157.5%22%20y%3D%2246%22%3E%26%23x3B1%3B%3C%2Ftext%3E%3Ctext%20font-family%3D%22Arial%22%20font-size%3D%2216%22%20font-style%3D%22italic%22%20text-anchor%3D%22middle%22%20x%3D%222.5%22%20y%3D%2276%22%3El%3C%2Ftext%3E%3Ctext%20font-family%3D%22math1c844e7b6f4c32a117bd5437956%22%20font-size%3D%2216%22%20text-anchor%3D%22middle%22%20x%3D%227.5%22%20y%3D%2276%22%3E.%3C%2Ftext%3E%3Ctext%20font-family%3D%22Arial%22%20font-size%3D%2216%22%20font-style%3D%22italic%22%20text-anchor%3D%22middle%22%20x%3D%2214.5%22%20y%3D%2276%22%3Ee%3C%2Ftext%3E%3Ctext%20font-family%3D%22Arial%22%20font-size%3D%2216%22%20font-style%3D%22italic%22%20text-anchor%3D%22middle%22%20x%3D%225.5%22%20y%3D%22110%22%3EP%3C%2Ftext%3E%3Ctext%20font-family%3D%22brackets4e06b854ad106cdec1d8cc9%22%20font-size%3D%2216%22%20text-anchor%3D%22start%22%20x%3D%2213.5%22%20y%3D%22101%22%3E%26%23x23A1%3B%3C%2Ftext%3E%3Ctext%20font-family%3D%22brackets4e06b854ad106cdec1d8cc9%22%20font-size%3D%2216%22%20text-anchor%3D%22start%22%20x%3D%2213.5%22%20y%3D%22115%22%3E%26%23x23A2%3B%3C%2Ftext%3E%3Ctext%20font-family%3D%22brackets4e06b854ad106cdec1d8cc9%22%20font-size%3D%2216%22%20text-anchor%3D%22start%22%20x%3D%2213.5%22%20y%3D%22129%22%3E%26%23x23A3%3B%3C%2Ftext%3E%3Ctext%20font-family%3D%22brackets4e06b854ad106cdec1d8cc9%22%20font-size%3D%2216%22%20text-anchor%3D%22start%22%20x%3D%22152.5%22%20y%3D%22101%22%3E%26%23x23A4%3B%3C%2Ftext%3E%3Ctext%20font-family%3D%22brackets4e06b854ad106cdec1d8cc9%22%20font-size%3D%2216%22%20text-anchor%3D%22start%22%20x%3D%22152.5%22%20y%3D%22115%22%3E%26%23x23A5%3B%3C%2Ftext%3E%3Ctext%20font-family%3D%22brackets4e06b854ad106cdec1d8cc9%22%20font-size%3D%2216%22%20text-anchor%3D%22start%22%20x%3D%22152.5%22%20y%3D%22129%22%3E%26%23x23A6%3B%3C%2Ftext%3E%3Cline%20stroke%3D%22%23000000%22%20stroke-linecap%3D%22square%22%20stroke-width%3D%221%22%20x1%3D%2225.5%22%20x2%3D%2270.5%22%20y1%3D%22104.5%22%20y2%3D%22104.5%22%2F%3E%3Ctext%20font-family%3D%22Arial%22%20font-size%3D%2216%22%20text-anchor%3D%22middle%22%20x%3D%2248.5%22%20y%3D%2299%22%3E1%3C%2Ftext%3E%3Ctext%20font-family%3D%22Arial%22%20font-size%3D%2216%22%20font-style%3D%22italic%22%20text-anchor%3D%22middle%22%20x%3D%2232.5%22%20y%3D%22121%22%3EF%3C%2Ftext%3E%3Ctext%20font-family%3D%22round_brackets18549f92a457f2409%22%20font-size%3D%2212%22%20text-anchor%3D%22middle%22%20x%3D%2240.5%22%20y%3D%22127%22%3E(%3C%2Ftext%3E%3Ctext%20font-family%3D%22Arial%22%20font-size%3D%2212%22%20font-style%3D%22italic%22%20text-anchor%3D%22middle%22%20x%3D%2247.5%22%20y%3D%22127%22%3Em%3C%2Ftext%3E%3Ctext%20font-family%3D%22math1c844e7b6f4c32a117bd5437956%22%20font-size%3D%2212%22%20text-anchor%3D%22middle%22%20x%3D%2255.5%22%20y%3D%22127%22%3E%2C%3C%2Ftext%3E%3Ctext%20font-family%3D%22Arial%22%20font-size%3D%2212%22%20font-style%3D%22italic%22%20text-anchor%3D%22middle%22%20x%3D%2260.5%22%20y%3D%22127%22%3En%3C%2Ftext%3E%3Ctext%20font-family%3D%22round_brackets18549f92a457f2409%22%20font-size%3D%2212%22%20text-anchor%3D%22middle%22%20x%3D%2266.5%22%20y%3D%22127%22%3E)%3C%2Ftext%3E%3Ctext%20font-family%3D%22math1c844e7b6f4c32a117bd5437956%22%20font-size%3D%2216%22%20text-anchor%3D%22middle%22%20x%3D%2281.5%22%20y%3D%22110%22%3E%26%23x2264%3B%3C%2Ftext%3E%3Cline%20stroke%3D%22%23000000%22%20stroke-linecap%3D%22square%22%20stroke-width%3D%221%22%20x1%3D%2291.5%22%20x2%3D%22148.5%22%20y1%3D%22104.5%22%20y2%3D%22104.5%22%2F%3E%3Ctext%20font-family%3D%22Arial%22%20font-size%3D%2216%22%20text-anchor%3D%22middle%22%20x%3D%22120.5%22%20y%3D%2299%22%3E1%3C%2Ftext%3E%3Ctext%20font-family%3D%22Arial%22%20font-size%3D%2216%22%20font-style%3D%22italic%22%20text-anchor%3D%22middle%22%20x%3D%2298.5%22%20y%3D%22121%22%3EF%3C%2Ftext%3E%3Ctext%20font-family%3D%22round_brackets18549f92a457f2409%22%20font-size%3D%2212%22%20text-anchor%3D%22middle%22%20x%3D%22106.5%22%20y%3D%22127%22%3E(%3C%2Ftext%3E%3Ctext%20font-family%3D%22Arial%22%20font-size%3D%2212%22%20font-style%3D%22italic%22%20text-anchor%3D%22middle%22%20x%3D%22111.5%22%20y%3D%22127%22%3E%26%23x3B1%3B%3C%2Ftext%3E%3Ctext%20font-family%3D%22math1c844e7b6f4c32a117bd5437956%22%20font-size%3D%2212%22%20text-anchor%3D%22middle%22%20x%3D%22117.5%22%20y%3D%22127%22%3E%3B%3C%2Ftext%3E%3Ctext%20font-family%3D%22Arial%22%20font-size%3D%2212%22%20font-style%3D%22italic%22%20text-anchor%3D%22middle%22%20x%3D%22125.5%22%20y%3D%22127%22%3Em%3C%2Ftext%3E%3Ctext%20font-family%3D%22math1c844e7b6f4c32a117bd5437956%22%20font-size%3D%2212%22%20text-anchor%3D%22middle%22%20x%3D%22133.5%22%20y%3D%22127%22%3E%2C%3C%2Ftext%3E%3Ctext%20font-family%3D%22Arial%22%20font-size%3D%2212%22%20font-style%3D%22italic%22%20text-anchor%3D%22middle%22%20x%3D%22138.5%22%20y%3D%22127%22%3En%3C%2Ftext%3E%3Ctext%20font-family%3D%22round_brackets18549f92a457f2409%22%20font-size%3D%2212%22%20text-anchor%3D%22middle%22%20x%3D%22144.5%22%20y%3D%22127%22%3E)%3C%2Ftext%3E%3Ctext%20font-family%3D%22math1c844e7b6f4c32a117bd5437956%22%20font-size%3D%2216%22%20text-anchor%3D%22middle%22%20x%3D%22166.5%22%20y%3D%22110%22%3E%3D%3C%2Ftext%3E%3Ctext%20font-family%3D%22Arial%22%20font-size%3D%2216%22%20font-style%3D%22italic%22%20text-anchor%3D%22middle%22%20x%3D%22179.5%22%20y%3D%22110%22%3E%26%23x3B1%3B%3C%2Ftext%3E%3Ctext%20font-family%3D%22a9ae65dcc5ba03ef2f0f633c7df668a%22%20font-size%3D%2216%22%20font-style%3D%22italic%22%20text-anchor%3D%22middle%22%20x%3D%224.5%22%20y%3D%22150%22%3Ea%3C%2Ftext%3E%3Ctext%20font-family%3D%22Arial%22%20font-size%3D%2216%22%20font-style%3D%22italic%22%20text-anchor%3D%22middle%22%20x%3D%2211.5%22%20y%3D%22150%22%3El%3C%2Ftext%3E%3Ctext%20font-family%3D%22Arial%22%20font-size%3D%2216%22%20font-style%3D%22italic%22%20text-anchor%3D%22middle%22%20x%3D%2217.5%22%20y%3D%22150%22%3Es%3C%2Ftext%3E%3Ctext%20font-family%3D%22Arial%22%20font-size%3D%2216%22%20font-style%3D%22italic%22%20text-anchor%3D%22middle%22%20x%3D%2225.5%22%20y%3D%22150%22%3Eo%3C%2Ftext%3E%3Ctext%20font-family%3D%22Arial%22%20font-size%3D%2216%22%20font-style%3D%22italic%22%20text-anchor%3D%22middle%22%20x%3D%225.5%22%20y%3D%22185%22%3EP%3C%2Ftext%3E%3Ctext%20font-family%3D%22brackets4e06b854ad106cdec1d8cc9%22%20font-size%3D%2216%22%20text-anchor%3D%22start%22%20x%3D%2213.5%22%20y%3D%22176%22%3E%26%23x23A1%3B%3C%2Ftext%3E%3Ctext%20font-family%3D%22brackets4e06b854ad106cdec1d8cc9%22%20font-size%3D%2216%22%20text-anchor%3D%22start%22%20x%3D%2213.5%22%20y%3D%22190%22%3E%26%23x23A2%3B%3C%2Ftext%3E%3Ctext%20font-family%3D%22brackets4e06b854ad106cdec1d8cc9%22%20font-size%3D%2216%22%20text-anchor%3D%22start%22%20x%3D%2213.5%22%20y%3D%22204%22%3E%26%23x23A3%3B%3C%2Ftext%3E%3Ctext%20font-family%3D%22brackets4e06b854ad106cdec1d8cc9%22%20font-size%3D%2216%22%20text-anchor%3D%22start%22%20x%3D%22144.5%22%20y%3D%22176%22%3E%26%23x23A4%3B%3C%2Ftext%3E%3Ctext%20font-family%3D%22brackets4e06b854ad106cdec1d8cc9%22%20font-size%3D%2216%22%20text-anchor%3D%22start%22%20x%3D%22144.5%22%20y%3D%22190%22%3E%26%23x23A5%3B%3C%2Ftext%3E%3Ctext%20font-family%3D%22brackets4e06b854ad106cdec1d8cc9%22%20font-size%3D%2216%22%20text-anchor%3D%22start%22%20x%3D%22144.5%22%20y%3D%22204%22%3E%26%23x23A6%3B%3C%2Ftext%3E%3Ctext%20font-family%3D%22Arial%22%20font-size%3D%2216%22%20font-style%3D%22italic%22%20text-anchor%3D%22middle%22%20x%3D%2228.5%22%20y%3D%22185%22%3EF%3C%2Ftext%3E%3Ctext%20font-family%3D%22round_brackets18549f92a457f2409%22%20font-size%3D%2212%22%20text-anchor%3D%22middle%22%20x%3D%2236.5%22%20y%3D%22191%22%3E(%3C%2Ftext%3E%3Ctext%20font-family%3D%22Arial%22%20font-size%3D%2212%22%20font-style%3D%22italic%22%20text-anchor%3D%22middle%22%20x%3D%2241.5%22%20y%3D%22191%22%3En%3C%2Ftext%3E%3Ctext%20font-family%3D%22math1c844e7b6f4c32a117bd5437956%22%20font-size%3D%2212%22%20text-anchor%3D%22middle%22%20x%3D%2248.5%22%20y%3D%22191%22%3E%2C%3C%2Ftext%3E%3Ctext%20font-family%3D%22Arial%22%20font-size%3D%2212%22%20font-style%3D%22italic%22%20text-anchor%3D%22middle%22%20x%3D%2255.5%22%20y%3D%22191%22%3Em%3C%2Ftext%3E%3Ctext%20font-family%3D%22round_brackets18549f92a457f2409%22%20font-size%3D%2212%22%20text-anchor%3D%22middle%22%20x%3D%2262.5%22%20y%3D%22191%22%3E)%3C%2Ftext%3E%3Ctext%20font-family%3D%22math1c844e7b6f4c32a117bd5437956%22%20font-size%3D%2216%22%20text-anchor%3D%22middle%22%20x%3D%2273.5%22%20y%3D%22185%22%3E%26%23x2264%3B%3C%2Ftext%3E%3Cline%20stroke%3D%22%23000000%22%20stroke-linecap%3D%22square%22%20stroke-width%3D%221%22%20x1%3D%2283.5%22%20x2%3D%22140.5%22%20y1%3D%22179.5%22%20y2%3D%22179.5%22%2F%3E%3Ctext%20font-family%3D%22Arial%22%20font-size%3D%2216%22%20text-anchor%3D%22middle%22%20x%3D%22112.5%22%20y%3D%22174%22%3E1%3C%2Ftext%3E%3Ctext%20font-family%3D%22Arial%22%20font-size%3D%2216%22%20font-style%3D%22italic%22%20text-anchor%3D%22middle%22%20x%3D%2290.5%22%20y%3D%22196%22%3EF%3C%2Ftext%3E%3Ctext%20font-family%3D%22round_brackets18549f92a457f2409%22%20font-size%3D%2212%22%20text-anchor%3D%22middle%22%20x%3D%2298.5%22%20y%3D%22202%22%3E(%3C%2Ftext%3E%3Ctext%20font-family%3D%22Arial%22%20font-size%3D%2212%22%20font-style%3D%22italic%22%20text-anchor%3D%22middle%22%20x%3D%22103.5%22%20y%3D%22202%22%3E%26%23x3B1%3B%3C%2Ftext%3E%3Ctext%20font-family%3D%22math1c844e7b6f4c32a117bd5437956%22%20font-size%3D%2212%22%20text-anchor%3D%22middle%22%20x%3D%22109.5%22%20y%3D%22202%22%3E%3B%3C%2Ftext%3E%3Ctext%20font-family%3D%22Arial%22%20font-size%3D%2212%22%20font-style%3D%22italic%22%20text-anchor%3D%22middle%22%20x%3D%22117.5%22%20y%3D%22202%22%3Em%3C%2Ftext%3E%3Ctext%20font-family%3D%22math1c844e7b6f4c32a117bd5437956%22%20font-size%3D%2212%22%20text-anchor%3D%22middle%22%20x%3D%22125.5%22%20y%3D%22202%22%3E%2C%3C%2Ftext%3E%3Ctext%20font-family%3D%22Arial%22%20font-size%3D%2212%22%20font-style%3D%22italic%22%20text-anchor%3D%22middle%22%20x%3D%22130.5%22%20y%3D%22202%22%3En%3C%2Ftext%3E%3Ctext%20font-family%3D%22round_brackets18549f92a457f2409%22%20font-size%3D%2212%22%20text-anchor%3D%22middle%22%20x%3D%22136.5%22%20y%3D%22202%22%3E)%3C%2Ftext%3E%3Ctext%20font-family%3D%22math1c844e7b6f4c32a117bd5437956%22%20font-size%3D%2216%22%20text-anchor%3D%22middle%22%20x%3D%22158.5%22%20y%3D%22185%22%3E%3D%3C%2Ftext%3E%3Ctext%20font-family%3D%22Arial%22%20font-size%3D%2216%22%20text-anchor%3D%22middle%22%20x%3D%22171.5%22%20y%3D%22185%22%3E1%3C%2Ftext%3E%3Ctext%20font-family%3D%22math1c844e7b6f4c32a117bd5437956%22%20font-size%3D%2216%22%20text-anchor%3D%22middle%22%20x%3D%22183.5%22%20y%3D%22185%22%3E%26%23x2212%3B%3C%2Ftext%3E%3Ctext%20font-family%3D%22Arial%22%20font-size%3D%2216%22%20font-style%3D%22italic%22%20text-anchor%3D%22middle%22%20x%3D%22195.5%22%20y%3D%22185%22%3E%26%23x3B1%3B%3C%2Ftext%3E%3Ctext%20font-family%3D%22math1c844e7b6f4c32a117bd5437956%22%20font-size%3D%2216%22%20text-anchor%3D%22middle%22%20x%3D%22223.5%22%20y%3D%22185%22%3E.%3C%2Ftext%3E%3Ctext%20font-family%3D%22math1c844e7b6f4c32a117bd5437956%22%20font-size%3D%2216%22%20text-anchor%3D%22middle%22%20x%3D%22228.5%22%20y%3D%22185%22%3E.%3C%2Ftext%3E%3Ctext%20font-family%3D%22math1c844e7b6f4c32a117bd5437956%22%20font-size%3D%2216%22%20text-anchor%3D%22middle%22%20x%3D%22233.5%22%20y%3D%22185%22%3E.%3C%2Ftext%3E%3Ctext%20font-family%3D%22math1c844e7b6f4c32a117bd5437956%22%20font-size%3D%2216%22%20text-anchor%3D%22middle%22%20x%3D%22238.5%22%20y%3D%22185%22%3E.%3C%2Ftext%3E%3Ctext%20font-family%3D%22math1c844e7b6f4c32a117bd5437956%22%20font-size%3D%2216%22%20text-anchor%3D%22middle%22%20x%3D%22243.5%22%20y%3D%22185%22%3E.%3C%2Ftext%3E%3Ctext%20font-family%3D%22math1c844e7b6f4c32a117bd5437956%22%20font-size%3D%2216%22%20text-anchor%3D%22middle%22%20x%3D%22248.5%22%20y%3D%22185%22%3E.%3C%2Ftext%3E%3Ctext%20font-family%3D%22math1c844e7b6f4c32a117bd5437956%22%20font-size%3D%2216%22%20text-anchor%3D%22middle%22%20x%3D%22253.5%22%20y%3D%22185%22%3E.%3C%2Ftext%3E%3Ctext%20font-family%3D%22math1c844e7b6f4c32a117bd5437956%22%20font-size%3D%2216%22%20text-anchor%3D%22middle%22%20x%3D%22258.5%22%20y%3D%22185%22%3E.%3C%2Ftext%3E%3Ctext%20font-family%3D%22math1c844e7b6f4c32a117bd5437956%22%20font-size%3D%2216%22%20text-anchor%3D%22middle%22%20x%3D%22263.5%22%20y%3D%22185%22%3E.%3C%2Ftext%3E%3Ctext%20font-family%3D%22math1c844e7b6f4c32a117bd5437956%22%20font-size%3D%2216%22%20text-anchor%3D%22middle%22%20x%3D%22268.5%22%20y%3D%22185%22%3E.%3C%2Ftext%3E%3Ctext%20font-family%3D%22math1c844e7b6f4c32a117bd5437956%22%20font-size%3D%2216%22%20text-anchor%3D%22middle%22%20x%3D%22273.5%22%20y%3D%22185%22%3E.%3C%2Ftext%3E%3Ctext%20font-family%3D%22math1c844e7b6f4c32a117bd5437956%22%20font-size%3D%2216%22%20text-anchor%3D%22middle%22%20x%3D%22278.5%22%20y%3D%22185%22%3E.%3C%2Ftext%3E%3Ctext%20font-family%3D%22math1c844e7b6f4c32a117bd5437956%22%20font-size%3D%2216%22%20text-anchor%3D%22middle%22%20x%3D%22283.5%22%20y%3D%22185%22%3E.%3C%2Ftext%3E%3Ctext%20font-family%3D%22math1c844e7b6f4c32a117bd5437956%22%20font-size%3D%2216%22%20text-anchor%3D%22middle%22%20x%3D%22288.5%22%20y%3D%22185%22%3E.%3C%2Ftext%3E%3Ctext%20font-family%3D%22round_brackets18549f92a457f2409%22%20font-size%3D%2216%22%20text-anchor%3D%22middle%22%20x%3D%22294.5%22%20y%3D%22185%22%3E(%3C%2Ftext%3E%3Ctext%20font-family%3D%22Arial%22%20font-size%3D%2216%22%20text-anchor%3D%22middle%22%20x%3D%22300.5%22%20y%3D%22185%22%3E1%3C%2Ftext%3E%3Ctext%20font-family%3D%22round_brackets18549f92a457f2409%22%20font-size%3D%2216%22%20text-anchor%3D%22middle%22%20x%3D%22307.5%22%20y%3D%22185%22%3E)%3C%2Ftext%3E%3Ctext%20font-family%3D%22Arial%22%20font-size%3D%2216%22%20font-style%3D%22italic%22%20text-anchor%3D%22middle%22%20x%3D%226.5%22%20y%3D%22226%22%3EH%3C%2Ftext%3E%3Ctext%20font-family%3D%22Arial%22%20font-size%3D%2216%22%20font-style%3D%22italic%22%20text-anchor%3D%22middle%22%20x%3D%2216.5%22%20y%3D%22226%22%3Eo%3C%2Ftext%3E%3Ctext%20font-family%3D%22Arial%22%20font-size%3D%2216%22%20font-style%3D%22italic%22%20text-anchor%3D%22middle%22%20x%3D%2227.5%22%20y%3D%22226%22%3Ew%3C%2Ftext%3E%3Ctext%20font-family%3D%22Arial%22%20font-size%3D%2216%22%20font-style%3D%22italic%22%20text-anchor%3D%22middle%22%20x%3D%2242.5%22%20y%3D%22226%22%3Ee%3C%2Ftext%3E%3Ctext%20font-family%3D%22Arial%22%20font-size%3D%2216%22%20font-style%3D%22italic%22%20text-anchor%3D%22middle%22%20x%3D%2251.5%22%20y%3D%22226%22%3Ev%3C%2Ftext%3E%3Ctext%20font-family%3D%22Arial%22%20font-size%3D%2216%22%20font-style%3D%22italic%22%20text-anchor%3D%22middle%22%20x%3D%2259.5%22%20y%3D%22226%22%3Ee%3C%2Ftext%3E%3Ctext%20font-family%3D%22Arial%22%20font-size%3D%2216%22%20font-style%3D%22italic%22%20text-anchor%3D%22middle%22%20x%3D%2266.5%22%20y%3D%22226%22%3Er%3C%2Ftext%3E%3Ctext%20font-family%3D%22Arial%22%20font-size%3D%2216%22%20font-style%3D%22italic%22%20text-anchor%3D%22middle%22%20x%3D%2278.5%22%20y%3D%22226%22%3Eb%3C%2Ftext%3E%3Ctext%20font-family%3D%22Arial%22%20font-size%3D%2216%22%20font-style%3D%22italic%22%20text-anchor%3D%22middle%22%20x%3D%2287.5%22%20y%3D%22226%22%3Ey%3C%2Ftext%3E%3Ctext%20font-family%3D%22Arial%22%20font-size%3D%2216%22%20font-style%3D%22italic%22%20text-anchor%3D%22middle%22%20x%3D%22100.5%22%20y%3D%22226%22%3Ed%3C%2Ftext%3E%3Ctext%20font-family%3D%22Arial%22%20font-size%3D%2216%22%20font-style%3D%22italic%22%20text-anchor%3D%22middle%22%20x%3D%22109.5%22%20y%3D%22226%22%3Ee%3C%2Ftext%3E%3Ctext%20font-family%3D%22a9ae65dcc5ba03ef2f0f633c7df668a%22%20font-size%3D%2216%22%20font-style%3D%22italic%22%20text-anchor%3D%22middle%22%20x%3D%22117.5%22%20y%3D%22226%22%3Ef%3C%2Ftext%3E%3Ctext%20font-family%3D%22Arial%22%20font-size%3D%2216%22%20font-style%3D%22italic%22%20text-anchor%3D%22middle%22%20x%3D%22124.5%22%20y%3D%22226%22%3Ei%3C%2Ftext%3E%3Ctext%20font-family%3D%22Arial%22%20font-size%3D%2216%22%20font-style%3D%22italic%22%20text-anchor%3D%22middle%22%20x%3D%22130.5%22%20y%3D%22226%22%3En%3C%2Ftext%3E%3Ctext%20font-family%3D%22a9ae65dcc5ba03ef2f0f633c7df668a%22%20font-size%3D%2216%22%20font-style%3D%22italic%22%20text-anchor%3D%22middle%22%20x%3D%22139.5%22%20y%3D%22226%22%3Ea%3C%2Ftext%3E%3Ctext%20font-family%3D%22Arial%22%20font-size%3D%2216%22%20font-style%3D%22italic%22%20text-anchor%3D%22middle%22%20x%3D%22146.5%22%20y%3D%22226%22%3Et%3C%2Ftext%3E%3Ctext%20font-family%3D%22Arial%22%20font-size%3D%2216%22%20font-style%3D%22italic%22%20text-anchor%3D%22middle%22%20x%3D%22150.5%22%20y%3D%22226%22%3Ei%3C%2Ftext%3E%3Ctext%20font-family%3D%22Arial%22%20font-size%3D%2216%22%20font-style%3D%22italic%22%20text-anchor%3D%22middle%22%20x%3D%22156.5%22%20y%3D%22226%22%3Eo%3C%2Ftext%3E%3Ctext%20font-family%3D%22Arial%22%20font-size%3D%2216%22%20font-style%3D%22italic%22%20text-anchor%3D%22middle%22%20x%3D%22165.5%22%20y%3D%22226%22%3En%3C%2Ftext%3E%3Ctext%20font-family%3D%22Arial%22%20font-size%3D%2216%22%20font-style%3D%22italic%22%20text-anchor%3D%22middle%22%20x%3D%225.5%22%20y%3D%22251%22%3EP%3C%2Ftext%3E%3Ctext%20font-family%3D%22brack_sm4e06b854ad106cdec1d8cc9%22%20font-size%3D%2216%22%20text-anchor%3D%22start%22%20x%3D%2213.5%22%20y%3D%22240%22%3E%26%23x23A1%3B%3C%2Ftext%3E%3Ctext%20font-family%3D%22brack_sm4e06b854ad106cdec1d8cc9%22%20font-size%3D%2216%22%20text-anchor%3D%22start%22%20x%3D%2213.5%22%20y%3D%22245%22%3E%26%23x23A2%3B%3C%2Ftext%3E%3Ctext%20font-family%3D%22brack_sm4e06b854ad106cdec1d8cc9%22%20font-size%3D%2216%22%20text-anchor%3D%22start%22%20x%3D%2213.5%22%20y%3D%22250%22%3E%26%23x23A2%3B%3C%2Ftext%3E%3Ctext%20font-family%3D%22brack_sm4e06b854ad106cdec1d8cc9%22%20font-size%3D%2216%22%20text-anchor%3D%22start%22%20x%3D%2213.5%22%20y%3D%22255%22%3E%26%23x23A2%3B%3C%2Ftext%3E%3Ctext%20font-family%3D%22brack_sm4e06b854ad106cdec1d8cc9%22%20font-size%3D%2216%22%20text-anchor%3D%22start%22%20x%3D%2213.5%22%20y%3D%22260%22%3E%26%23x23A3%3B%3C%2Ftext%3E%3Ctext%20font-family%3D%22brack_sm4e06b854ad106cdec1d8cc9%22%20font-size%3D%2216%22%20text-anchor%3D%22start%22%20x%3D%22154.5%22%20y%3D%22240%22%3E%26%23x23A4%3B%3C%2Ftext%3E%3Ctext%20font-family%3D%22brack_sm4e06b854ad106cdec1d8cc9%22%20font-size%3D%2216%22%20text-anchor%3D%22start%22%20x%3D%22154.5%22%20y%3D%22245%22%3E%26%23x23A5%3B%3C%2Ftext%3E%3Ctext%20font-family%3D%22brack_sm4e06b854ad106cdec1d8cc9%22%20font-size%3D%2216%22%20text-anchor%3D%22start%22%20x%3D%22154.5%22%20y%3D%22250%22%3E%26%23x23A5%3B%3C%2Ftext%3E%3Ctext%20font-family%3D%22brack_sm4e06b854ad106cdec1d8cc9%22%20font-size%3D%2216%22%20text-anchor%3D%22start%22%20x%3D%22154.5%22%20y%3D%22255%22%3E%26%23x23A5%3B%3C%2Ftext%3E%3Ctext%20font-family%3D%22brack_sm4e06b854ad106cdec1d8cc9%22%20font-size%3D%2216%22%20text-anchor%3D%22start%22%20x%3D%22154.5%22%20y%3D%22260%22%3E%26%23x23A6%3B%3C%2Ftext%3E%3Ctext%20font-family%3D%22Arial%22%20font-size%3D%2216%22%20font-style%3D%22italic%22%20text-anchor%3D%22middle%22%20x%3D%2227.5%22%20y%3D%22251%22%3EF%3C%2Ftext%3E%3Ctext%20font-family%3D%22round_brackets18549f92a457f2409%22%20font-size%3D%2212%22%20text-anchor%3D%22middle%22%20x%3D%2235.5%22%20y%3D%22257%22%3E(%3C%2Ftext%3E%3Ctext%20font-family%3D%22Arial%22%20font-size%3D%2212%22%20font-style%3D%22italic%22%20text-anchor%3D%22middle%22%20x%3D%2240.5%22%20y%3D%22257%22%3En%3C%2Ftext%3E%3Ctext%20font-family%3D%22math1c844e7b6f4c32a117bd5437956%22%20font-size%3D%2212%22%20text-anchor%3D%22middle%22%20x%3D%2247.5%22%20y%3D%22257%22%3E%2C%3C%2Ftext%3E%3Ctext%20font-family%3D%22Arial%22%20font-size%3D%2212%22%20font-style%3D%22italic%22%20text-anchor%3D%22middle%22%20x%3D%2254.5%22%20y%3D%22257%22%3Em%3C%2Ftext%3E%3Ctext%20font-family%3D%22round_brackets18549f92a457f2409%22%20font-size%3D%2212%22%20text-anchor%3D%22middle%22%20x%3D%2261.5%22%20y%3D%22257%22%3E)%3C%2Ftext%3E%3Ctext%20font-family%3D%22math1c844e7b6f4c32a117bd5437956%22%20font-size%3D%2216%22%20text-anchor%3D%22middle%22%20x%3D%2272.5%22%20y%3D%22251%22%3E%26%23x2265%3B%3C%2Ftext%3E%3Ctext%20font-family%3D%22Arial%22%20font-size%3D%2216%22%20font-style%3D%22italic%22%20text-anchor%3D%22middle%22%20x%3D%2285.5%22%20y%3D%22251%22%3EF%3C%2Ftext%3E%3Ctext%20font-family%3D%22round_brackets18549f92a457f2409%22%20font-size%3D%2212%22%20text-anchor%3D%22middle%22%20x%3D%2293.5%22%20y%3D%22257%22%3E(%3C%2Ftext%3E%3Ctext%20font-family%3D%22Arial%22%20font-size%3D%2212%22%20text-anchor%3D%22middle%22%20x%3D%2298.5%22%20y%3D%22257%22%3E1%3C%2Ftext%3E%3Ctext%20font-family%3D%22math1c844e7b6f4c32a117bd5437956%22%20font-size%3D%2212%22%20text-anchor%3D%22middle%22%20x%3D%22108.5%22%20y%3D%22257%22%3E%26%23x2212%3B%3C%2Ftext%3E%3Ctext%20font-family%3D%22Arial%22%20font-size%3D%2212%22%20font-style%3D%22italic%22%20text-anchor%3D%22middle%22%20x%3D%22117.5%22%20y%3D%22257%22%3E%26%23x3B1%3B%3C%2Ftext%3E%3Ctext%20font-family%3D%22math1c844e7b6f4c32a117bd5437956%22%20font-size%3D%2212%22%20text-anchor%3D%22middle%22%20x%3D%22123.5%22%20y%3D%22257%22%3E%3B%3C%2Ftext%3E%3Ctext%20font-family%3D%22Arial%22%20font-size%3D%2212%22%20font-style%3D%22italic%22%20text-anchor%3D%22middle%22%20x%3D%22129.5%22%20y%3D%22257%22%3En%3C%2Ftext%3E%3Ctext%20font-family%3D%22math1c844e7b6f4c32a117bd5437956%22%20font-size%3D%2212%22%20text-anchor%3D%22middle%22%20x%3D%22136.5%22%20y%3D%22257%22%3E%2C%3C%2Ftext%3E%3Ctext%20font-family%3D%22Arial%22%20font-size%3D%2212%22%20font-style%3D%22italic%22%20text-anchor%3D%22middle%22%20x%3D%22143.5%22%20y%3D%22257%22%3Em%3C%2Ftext%3E%3Ctext%20font-family%3D%22round_brackets18549f92a457f2409%22%20font-size%3D%2212%22%20text-anchor%3D%22middle%22%20x%3D%22150.5%22%20y%3D%22257%22%3E)%3C%2Ftext%3E%3Ctext%20font-family%3D%22math1c844e7b6f4c32a117bd5437956%22%20font-size%3D%2216%22%20text-anchor%3D%22middle%22%20x%3D%22167.5%22%20y%3D%22251%22%3E%3D%3C%2Ftext%3E%3Ctext%20font-family%3D%22Arial%22%20font-size%3D%2216%22%20text-anchor%3D%22middle%22%20x%3D%22180.5%22%20y%3D%22251%22%3E1%3C%2Ftext%3E%3Ctext%20font-family%3D%22math1c844e7b6f4c32a117bd5437956%22%20font-size%3D%2216%22%20text-anchor%3D%22middle%22%20x%3D%22192.5%22%20y%3D%22251%22%3E%26%23x2212%3B%3C%2Ftext%3E%3Ctext%20font-family%3D%22Arial%22%20font-size%3D%2216%22%20font-style%3D%22italic%22%20text-anchor%3D%22middle%22%20x%3D%22204.5%22%20y%3D%22251%22%3E%26%23x3B1%3B%3C%2Ftext%3E%3Ctext%20font-family%3D%22math1c844e7b6f4c32a117bd5437956%22%20font-size%3D%2216%22%20text-anchor%3D%22middle%22%20x%3D%22232.5%22%20y%3D%22251%22%3E.%3C%2Ftext%3E%3Ctext%20font-family%3D%22math1c844e7b6f4c32a117bd5437956%22%20font-size%3D%2216%22%20text-anchor%3D%22middle%22%20x%3D%22237.5%22%20y%3D%22251%22%3E.%3C%2Ftext%3E%3Ctext%20font-family%3D%22math1c844e7b6f4c32a117bd5437956%22%20font-size%3D%2216%22%20text-anchor%3D%22middle%22%20x%3D%22242.5%22%20y%3D%22251%22%3E.%3C%2Ftext%3E%3Ctext%20font-family%3D%22math1c844e7b6f4c32a117bd5437956%22%20font-size%3D%2216%22%20text-anchor%3D%22middle%22%20x%3D%22247.5%22%20y%3D%22251%22%3E.%3C%2Ftext%3E%3Ctext%20font-family%3D%22math1c844e7b6f4c32a117bd5437956%22%20font-size%3D%2216%22%20text-anchor%3D%22middle%22%20x%3D%22252.5%22%20y%3D%22251%22%3E.%3C%2Ftext%3E%3Ctext%20font-family%3D%22math1c844e7b6f4c32a117bd5437956%22%20font-size%3D%2216%22%20text-anchor%3D%22middle%22%20x%3D%22257.5%22%20y%3D%22251%22%3E.%3C%2Ftext%3E%3Ctext%20font-family%3D%22math1c844e7b6f4c32a117bd5437956%22%20font-size%3D%2216%22%20text-anchor%3D%22middle%22%20x%3D%22262.5%22%20y%3D%22251%22%3E.%3C%2Ftext%3E%3Ctext%20font-family%3D%22math1c844e7b6f4c32a117bd5437956%22%20font-size%3D%2216%22%20text-anchor%3D%22middle%22%20x%3D%22267.5%22%20y%3D%22251%22%3E.%3C%2Ftext%3E%3Ctext%20font-family%3D%22math1c844e7b6f4c32a117bd5437956%22%20font-size%3D%2216%22%20text-anchor%3D%22middle%22%20x%3D%22272.5%22%20y%3D%22251%22%3E.%3C%2Ftext%3E%3Ctext%20font-family%3D%22math1c844e7b6f4c32a117bd5437956%22%20font-size%3D%2216%22%20text-anchor%3D%22middle%22%20x%3D%22277.5%22%20y%3D%22251%22%3E.%3C%2Ftext%3E%3Ctext%20font-family%3D%22math1c844e7b6f4c32a117bd5437956%22%20font-size%3D%2216%22%20text-anchor%3D%22middle%22%20x%3D%22282.5%22%20y%3D%22251%22%3E.%3C%2Ftext%3E%3Ctext%20font-family%3D%22math1c844e7b6f4c32a117bd5437956%22%20font-size%3D%2216%22%20text-anchor%3D%22middle%22%20x%3D%22287.5%22%20y%3D%22251%22%3E.%3C%2Ftext%3E%3Ctext%20font-family%3D%22math1c844e7b6f4c32a117bd5437956%22%20font-size%3D%2216%22%20text-anchor%3D%22middle%22%20x%3D%22292.5%22%20y%3D%22251%22%3E.%3C%2Ftext%3E%3Ctext%20font-family%3D%22math1c844e7b6f4c32a117bd5437956%22%20font-size%3D%2216%22%20text-anchor%3D%22middle%22%20x%3D%22297.5%22%20y%3D%22251%22%3E.%3C%2Ftext%3E%3Ctext%20font-family%3D%22math1c844e7b6f4c32a117bd5437956%22%20font-size%3D%2216%22%20text-anchor%3D%22middle%22%20x%3D%22302.5%22%20y%3D%22251%22%3E.%3C%2Ftext%3E%3Ctext%20font-family%3D%22round_brackets18549f92a457f2409%22%20font-size%3D%2216%22%20text-anchor%3D%22middle%22%20x%3D%22308.5%22%20y%3D%22251%22%3E(%3C%2Ftext%3E%3Ctext%20font-family%3D%22Arial%22%20font-size%3D%2216%22%20text-anchor%3D%22middle%22%20x%3D%22314.5%22%20y%3D%22251%22%3E2%3C%2Ftext%3E%3Ctext%20font-family%3D%22round_brackets18549f92a457f2409%22%20font-size%3D%2216%22%20text-anchor%3D%22middle%22%20x%3D%22321.5%22%20y%3D%22251%22%3E)%3C%2Ftext%3E%3Ctext%20font-family%3D%22Arial%22%20font-size%3D%2216%22%20font-style%3D%22italic%22%20text-anchor%3D%22middle%22%20x%3D%225.5%22%20y%3D%22291%22%3EF%3C%2Ftext%3E%3Ctext%20font-family%3D%22Arial%22%20font-size%3D%2216%22%20font-style%3D%22italic%22%20text-anchor%3D%22middle%22%20x%3D%2212.5%22%20y%3D%22291%22%3Er%3C%2Ftext%3E%3Ctext%20font-family%3D%22Arial%22%20font-size%3D%2216%22%20font-style%3D%22italic%22%20text-anchor%3D%22middle%22%20x%3D%2219.5%22%20y%3D%22291%22%3Eo%3C%2Ftext%3E%3Ctext%20font-family%3D%22Arial%22%20font-size%3D%2216%22%20font-style%3D%22italic%22%20text-anchor%3D%22middle%22%20x%3D%2230.5%22%20y%3D%22291%22%3Em%3C%2Ftext%3E%3Ctext%20font-family%3D%22round_brackets18549f92a457f2409%22%20font-size%3D%2216%22%20text-anchor%3D%22middle%22%20x%3D%2245.5%22%20y%3D%22291%22%3E(%3C%2Ftext%3E%3Ctext%20font-family%3D%22Arial%22%20font-size%3D%2216%22%20text-anchor%3D%22middle%22%20x%3D%2251.5%22%20y%3D%22291%22%3E1%3C%2Ftext%3E%3Ctext%20font-family%3D%22round_brackets18549f92a457f2409%22%20font-size%3D%2216%22%20text-anchor%3D%22middle%22%20x%3D%2258.5%22%20y%3D%22291%22%3E)%3C%2Ftext%3E%3Ctext%20font-family%3D%22a9ae65dcc5ba03ef2f0f633c7df668a%22%20font-size%3D%2216%22%20font-style%3D%22italic%22%20text-anchor%3D%22middle%22%20x%3D%2269.5%22%20y%3D%22291%22%3Ea%3C%2Ftext%3E%3Ctext%20font-family%3D%22Arial%22%20font-size%3D%2216%22%20font-style%3D%22italic%22%20text-anchor%3D%22middle%22%20x%3D%2278.5%22%20y%3D%22291%22%3En%3C%2Ftext%3E%3Ctext%20font-family%3D%22Arial%22%20font-size%3D%2216%22%20font-style%3D%22italic%22%20text-anchor%3D%22middle%22%20x%3D%2287.5%22%20y%3D%22291%22%3Ed%3C%2Ftext%3E%3Ctext%20font-family%3D%22round_brackets18549f92a457f2409%22%20font-size%3D%2216%22%20text-anchor%3D%22middle%22%20x%3D%22100.5%22%20y%3D%22291%22%3E(%3C%2Ftext%3E%3Ctext%20font-family%3D%22Arial%22%20font-size%3D%2216%22%20text-anchor%3D%22middle%22%20x%3D%22106.5%22%20y%3D%22291%22%3E2%3C%2Ftext%3E%3Ctext%20font-family%3D%22round_brackets18549f92a457f2409%22%20font-size%3D%2216%22%20text-anchor%3D%22middle%22%20x%3D%22113.5%22%20y%3D%22291%22%3E)%3C%2Ftext%3E%3Ctext%20font-family%3D%22Arial%22%20font-size%3D%2216%22%20font-style%3D%22italic%22%20text-anchor%3D%22middle%22%20x%3D%22126.5%22%20y%3D%22291%22%3Ew%3C%2Ftext%3E%3Ctext%20font-family%3D%22Arial%22%20font-size%3D%2216%22%20font-style%3D%22italic%22%20text-anchor%3D%22middle%22%20x%3D%22136.5%22%20y%3D%22291%22%3Ee%3C%2Ftext%3E%3Ctext%20font-family%3D%22Arial%22%20font-size%3D%2216%22%20font-style%3D%22italic%22%20text-anchor%3D%22middle%22%20x%3D%22150.5%22%20y%3D%22291%22%3Eg%3C%2Ftext%3E%3Ctext%20font-family%3D%22Arial%22%20font-size%3D%2216%22%20font-style%3D%22italic%22%20text-anchor%3D%22middle%22%20x%3D%22159.5%22%20y%3D%22291%22%3Ee%3C%2Ftext%3E%3Ctext%20font-family%3D%22Arial%22%20font-size%3D%2216%22%20font-style%3D%22italic%22%20text-anchor%3D%22middle%22%20x%3D%22166.5%22%20y%3D%22291%22%3Et%3C%2Ftext%3E%3Cline%20stroke%3D%22%23000000%22%20stroke-linecap%3D%22square%22%20stroke-width%3D%221%22%20x1%3D%222.5%22%20x2%3D%2259.5%22%20y1%3D%22320.5%22%20y2%3D%22320.5%22%2F%3E%3Ctext%20font-family%3D%22Arial%22%20font-size%3D%2216%22%20text-anchor%3D%22middle%22%20x%3D%2231.5%22%20y%3D%22315%22%3E1%3C%2Ftext%3E%3Ctext%20font-family%3D%22Arial%22%20font-size%3D%2216%22%20font-style%3D%22italic%22%20text-anchor%3D%22middle%22%20x%3D%229.5%22%20y%3D%22337%22%3EF%3C%2Ftext%3E%3Ctext%20font-family%3D%22round_brackets18549f92a457f2409%22%20font-size%3D%2212%22%20text-anchor%3D%22middle%22%20x%3D%2217.5%22%20y%3D%22343%22%3E(%3C%2Ftext%3E%3Ctext%20font-family%3D%22Arial%22%20font-size%3D%2212%22%20font-style%3D%22italic%22%20text-anchor%3D%22middle%22%20x%3D%2222.5%22%20y%3D%22343%22%3E%26%23x3B1%3B%3C%2Ftext%3E%3Ctext%20font-family%3D%22math1c844e7b6f4c32a117bd5437956%22%20font-size%3D%2212%22%20text-anchor%3D%22middle%22%20x%3D%2228.5%22%20y%3D%22343%22%3E%3B%3C%2Ftext%3E%3Ctext%20font-family%3D%22Arial%22%20font-size%3D%2212%22%20font-style%3D%22italic%22%20text-anchor%3D%22middle%22%20x%3D%2236.5%22%20y%3D%22343%22%3Em%3C%2Ftext%3E%3Ctext%20font-family%3D%22math1c844e7b6f4c32a117bd5437956%22%20font-size%3D%2212%22%20text-anchor%3D%22middle%22%20x%3D%2244.5%22%20y%3D%22343%22%3E%2C%3C%2Ftext%3E%3Ctext%20font-family%3D%22Arial%22%20font-size%3D%2212%22%20font-style%3D%22italic%22%20text-anchor%3D%22middle%22%20x%3D%2249.5%22%20y%3D%22343%22%3En%3C%2Ftext%3E%3Ctext%20font-family%3D%22round_brackets18549f92a457f2409%22%20font-size%3D%2212%22%20text-anchor%3D%22middle%22%20x%3D%2255.5%22%20y%3D%22343%22%3E)%3C%2Ftext%3E%3Ctext%20font-family%3D%22math1c844e7b6f4c32a117bd5437956%22%20font-size%3D%2216%22%20text-anchor%3D%22middle%22%20x%3D%2270.5%22%20y%3D%22326%22%3E%3D%3C%2Ftext%3E%3Ctext%20font-family%3D%22Arial%22%20font-size%3D%2216%22%20font-style%3D%22italic%22%20text-anchor%3D%22middle%22%20x%3D%2284.5%22%20y%3D%22326%22%3EF%3C%2Ftext%3E%3Ctext%20font-family%3D%22round_brackets18549f92a457f2409%22%20font-size%3D%2212%22%20text-anchor%3D%22middle%22%20x%3D%2292.5%22%20y%3D%22332%22%3E(%3C%2Ftext%3E%3Ctext%20font-family%3D%22Arial%22%20font-size%3D%2212%22%20text-anchor%3D%22middle%22%20x%3D%2297.5%22%20y%3D%22332%22%3E1%3C%2Ftext%3E%3Ctext%20font-family%3D%22math1c844e7b6f4c32a117bd5437956%22%20font-size%3D%2212%22%20text-anchor%3D%22middle%22%20x%3D%22107.5%22%20y%3D%22332%22%3E%26%23x2212%3B%3C%2Ftext%3E%3Ctext%20font-family%3D%22Arial%22%20font-size%3D%2212%22%20font-style%3D%22italic%22%20text-anchor%3D%22middle%22%20x%3D%22116.5%22%20y%3D%22332%22%3E%26%23x3B1%3B%3C%2Ftext%3E%3Ctext%20font-family%3D%22math1c844e7b6f4c32a117bd5437956%22%20font-size%3D%2212%22%20text-anchor%3D%22middle%22%20x%3D%22122.5%22%20y%3D%22332%22%3E%3B%3C%2Ftext%3E%3Ctext%20font-family%3D%22Arial%22%20font-size%3D%2212%22%20font-style%3D%22italic%22%20text-anchor%3D%22middle%22%20x%3D%22128.5%22%20y%3D%22332%22%3En%3C%2Ftext%3E%3Ctext%20font-family%3D%22math1c844e7b6f4c32a117bd5437956%22%20font-size%3D%2212%22%20text-anchor%3D%22middle%22%20x%3D%22135.5%22%20y%3D%22332%22%3E%2C%3C%2Ftext%3E%3Ctext%20font-family%3D%22Arial%22%20font-size%3D%2212%22%20font-style%3D%22italic%22%20text-anchor%3D%22middle%22%20x%3D%22142.5%22%20y%3D%22332%22%3Em%3C%2Ftext%3E%3Ctext%20font-family%3D%22round_brackets18549f92a457f2409%22%20font-size%3D%2212%22%20text-anchor%3D%22middle%22%20x%3D%22149.5%22%20y%3D%22332%22%3E)%3C%2Ftext%3E%3Ctext%20font-family%3D%22Arial%22%20font-size%3D%2216%22%20font-style%3D%22italic%22%20text-anchor%3D%22middle%22%20x%3D%225.5%22%20y%3D%22377%22%3EF%3C%2Ftext%3E%3Ctext%20font-family%3D%22round_brackets18549f92a457f2409%22%20font-size%3D%2212%22%20text-anchor%3D%22middle%22%20x%3D%2213.5%22%20y%3D%22383%22%3E(%3C%2Ftext%3E%3Ctext%20font-family%3D%22Arial%22%20font-size%3D%2212%22%20font-style%3D%22italic%22%20text-anchor%3D%22middle%22%20x%3D%2218.5%22%20y%3D%22383%22%3E%26%23x3B1%3B%3C%2Ftext%3E%3Ctext%20font-family%3D%22math1c844e7b6f4c32a117bd5437956%22%20font-size%3D%2212%22%20text-anchor%3D%22middle%22%20x%3D%2224.5%22%20y%3D%22383%22%3E%3B%3C%2Ftext%3E%3Ctext%20font-family%3D%22Arial%22%20font-size%3D%2212%22%20font-style%3D%22italic%22%20text-anchor%3D%22middle%22%20x%3D%2232.5%22%20y%3D%22383%22%3Em%3C%2Ftext%3E%3Ctext%20font-family%3D%22math1c844e7b6f4c32a117bd5437956%22%20font-size%3D%2212%22%20text-anchor%3D%22middle%22%20x%3D%2240.5%22%20y%3D%22383%22%3E%2C%3C%2Ftext%3E%3Ctext%20font-family%3D%22Arial%22%20font-size%3D%2212%22%20font-style%3D%22italic%22%20text-anchor%3D%22middle%22%20x%3D%2245.5%22%20y%3D%22383%22%3En%3C%2Ftext%3E%3Ctext%20font-family%3D%22round_brackets18549f92a457f2409%22%20font-size%3D%2212%22%20text-anchor%3D%22middle%22%20x%3D%2251.5%22%20y%3D%22383%22%3E)%3C%2Ftext%3E%3Ctext%20font-family%3D%22math1c844e7b6f4c32a117bd5437956%22%20font-size%3D%2216%22%20text-anchor%3D%22middle%22%20x%3D%2262.5%22%20y%3D%22377%22%3E%3D%3C%2Ftext%3E%3Cline%20stroke%3D%22%23000000%22%20stroke-linecap%3D%22square%22%20stroke-width%3D%221%22%20x1%3D%2273.5%22%20x2%3D%22149.5%22%20y1%3D%22371.5%22%20y2%3D%22371.5%22%2F%3E%3Ctext%20font-family%3D%22Arial%22%20font-size%3D%2216%22%20text-anchor%3D%22middle%22%20x%3D%22111.5%22%20y%3D%22366%22%3E1%3C%2Ftext%3E%3Ctext%20font-family%3D%22Arial%22%20font-size%3D%2216%22%20font-style%3D%22italic%22%20text-anchor%3D%22middle%22%20x%3D%2280.5%22%20y%3D%22388%22%3EF%3C%2Ftext%3E%3Ctext%20font-family%3D%22round_brackets18549f92a457f2409%22%20font-size%3D%2212%22%20text-anchor%3D%22middle%22%20x%3D%2288.5%22%20y%3D%22394%22%3E(%3C%2Ftext%3E%3Ctext%20font-family%3D%22Arial%22%20font-size%3D%2212%22%20text-anchor%3D%22middle%22%20x%3D%2293.5%22%20y%3D%22394%22%3E1%3C%2Ftext%3E%3Ctext%20font-family%3D%22math1c844e7b6f4c32a117bd5437956%22%20font-size%3D%2212%22%20text-anchor%3D%22middle%22%20x%3D%22103.5%22%20y%3D%22394%22%3E%26%23x2212%3B%3C%2Ftext%3E%3Ctext%20font-family%3D%22Arial%22%20font-size%3D%2212%22%20font-style%3D%22italic%22%20text-anchor%3D%22middle%22%20x%3D%22112.5%22%20y%3D%22394%22%3E%26%23x3B1%3B%3C%2Ftext%3E%3Ctext%20font-family%3D%22math1c844e7b6f4c32a117bd5437956%22%20font-size%3D%2212%22%20text-anchor%3D%22middle%22%20x%3D%22118.5%22%20y%3D%22394%22%3E%3B%3C%2Ftext%3E%3Ctext%20font-family%3D%22Arial%22%20font-size%3D%2212%22%20font-style%3D%22italic%22%20text-anchor%3D%22middle%22%20x%3D%22124.5%22%20y%3D%22394%22%3En%3C%2Ftext%3E%3Ctext%20font-family%3D%22math1c844e7b6f4c32a117bd5437956%22%20font-size%3D%2212%22%20text-anchor%3D%22middle%22%20x%3D%22131.5%22%20y%3D%22394%22%3E%2C%3C%2Ftext%3E%3Ctext%20font-family%3D%22Arial%22%20font-size%3D%2212%22%20font-style%3D%22italic%22%20text-anchor%3D%22middle%22%20x%3D%22138.5%22%20y%3D%22394%22%3Em%3C%2Ftext%3E%3Ctext%20font-family%3D%22round_brackets18549f92a457f2409%22%20font-size%3D%2212%22%20text-anchor%3D%22middle%22%20x%3D%22145.5%22%20y%3D%22394%22%3E)%3C%2Ftext%3E%3C%2Fsvg%3E)
Hence the prove
%3C%2Fmo%3E%3C%2Fmrow%3E%3C%2Fmsub%3E%3Cmo%3E%3D%3C%2Fmo%3E%3Cmfrac%3E%3Cmn%3E1%3C%2Fmn%3E%3Cmsub%3E%3Cmi%3EF%3C%2Fmi%3E%3Cmrow%3E%3Cmo%3E(%3C%2Fmo%3E%3Cmn%3E1%3C%2Fmn%3E%3Cmo%3E-%3C%2Fmo%3E%3Cmi%3E%26%23x3B1%3B%3C%2Fmi%3E%3Cmo%3E%3B%3C%2Fmo%3E%3Cmi%3En%3C%2Fmi%3E%3Cmo%3E%2C%3C%2Fmo%3E%3Cmi%3Em%3C%2Fmi%3E%3Cmo%3E)%3C%2Fmo%3E%3C%2Fmrow%3E%3C%2Fmsub%3E%3C%2Fmfrac%3E%3C%2Fmath%3E--%3E%3Cdefs%3E%3Cstyle%20type%3D%22text%2Fcss%22%3E%40font-face%7Bfont-family%3A'math16c0457e5337c5b165512367452'%3Bsrc%3Aurl(data%3Afont%2Ftruetype%3Bcharset%3Dutf-8%3Bbase64%2CAAEAAAAMAIAAAwBAT1MvMi7iBBMAAADMAAAATmNtYXDEvmKUAAABHAAAAExjdnQgDVUNBwAAAWgAAAA6Z2x5ZoPi2VsAAAGkAAABXGhlYWQQC2qxAAADAAAAADZoaGVhCGsXSAAAAzgAAAAkaG10eE2rRkcAAANcAAAAFGxvY2EAHTwYAAADcAAAABhtYXhwBT0FPgAAA4gAAAAgbmFtZaBxlY4AAAOoAAABn3Bvc3QB9wD6AAAFSAAAACBwcmVwa1uragAABWgAAAAUAAADSwGQAAUAAAQABAAAAAAABAAEAAAAAAAAAQEAAAAAAAAAAAAAAAAAAAAAAAAAAAAAAAAAAAAAACAgICAAAAAg1UADev96AAAD6ACWAAAAAAACAAEAAQAAABQAAwABAAAAFAAEADgAAAAKAAgAAgACACwAOwA9IhL%2F%2FwAAACwAOwA9IhL%2F%2F%2F%2FV%2F8f%2Fxt3yAAEAAAAAAAAAAAAAAAABVAMsAIABAABWACoCWAIeAQ4BLAIsAFoBgAKAAKAA1ACAAAAAAAAAACsAVQCAAKsA1QEAASsABwAAAAIAVQAAAwADqwADAAcAADMRIRElIREhVQKr%2FasCAP4AA6v8VVUDAAABAFX%2FZADVAIAACgAAMzUzFRQGByc%2BATdVgC8vGx4eAYB6PVEUKQ40MQACAFX%2FZADVAgAACgAOAAAzNTMVFAYHJz4BNwMzNSNVgC8vGx4eAUSAgIB6PVEUKQ40MQGAgAACAIAA6wLVAhUAAwAHAGUYAbAIELAG1LAGELAF1LAIELAB1LABELAA1LAGELAHPLAFELAEPLABELACPLAAELADPACwCBCwBtSwBhCwB9SwBxCwAdSwARCwAtSwBhCwBTywBxCwBDywARCwADywAhCwAzwxMBMhNSEdASE1gAJV%2FasCVQHAVdVVVQABAIABVQLVAasAAwAwGAGwBBCxAAP2sAM8sQIH9bABPLEFA%2BYAsQAAExCxAAblsQABExCwATyxAwX1sAI8EyEVIYACVf2rAatWAAEAAAABAADVeM5BXw889QADBAD%2F%2F%2F%2F%2F1joTc%2F%2F%2F%2F%2F%2FWOhNzAAD%2FIASAA6sAAAAKAAIAAQAAAAAAAQAAA%2Bj%2FagAAF3AAAP%2B2BIAAAQAAAAAAAAAAAAAAAAAAAAUDUgBVATMAVQEEAFUDVgCAA1YAgAAAAAAAAAAoAAAAUgAAAIgAAAESAAABXAABAAAABQBeAAUAAAAAAAIAgAQAAAAAAAQAAN4AAAAAAAAAFQECAAAAAAAAAAEAEgAAAAAAAAAAAAIADgASAAAAAAAAAAMAMAAgAAAAAAAAAAQAEgBQAAAAAAAAAAUAFgBiAAAAAAAAAAYACQB4AAAAAAAAAAgAHACBAAEAAAAAAAEAEgAAAAEAAAAAAAIADgASAAEAAAAAAAMAMAAgAAEAAAAAAAQAEgBQAAEAAAAAAAUAFgBiAAEAAAAAAAYACQB4AAEAAAAAAAgAHACBAAMAAQQJAAEAEgAAAAMAAQQJAAIADgASAAMAAQQJAAMAMAAgAAMAAQQJAAQAEgBQAAMAAQQJAAUAFgBiAAMAAQQJAAYACQB4AAMAAQQJAAgAHACBAE0AYQB0AGgAIABGAG8AbgB0AFIAZQBnAHUAbABhAHIATQBhAHQAaABzACAARgBvAHIAIABNAG8AcgBlACAATQBhAHQAaAAgAEYAbwBuAHQATQBhAHQAaAAgAEYAbwBuAHQAVgBlAHIAcwBpAG8AbgAgADEALgAwTWF0aF9Gb250AE0AYQB0AGgAcwAgAEYAbwByACAATQBvAHIAZQAAAwAAAAAAAAH0APoAAAAAAAAAAAAAAAAAAAAAAAAAALkHEQAAjYUYALIAAAAVFBOxAAE%2F)format('truetype')%3Bfont-weight%3Anormal%3Bfont-style%3Anormal%3B%7D%40font-face%7Bfont-family%3A'round_brackets18549f92a457f2409'%3Bsrc%3Aurl(data%3Afont%2Ftruetype%3Bcharset%3Dutf-8%3Bbase64%2CAAEAAAAMAIAAAwBAT1MvMjwHLFQAAADMAAAATmNtYXDf7xCrAAABHAAAADxjdnQgBAkDLgAAAVgAAAASZ2x5ZmAOz2cAAAFsAAABJGhlYWQOKih8AAACkAAAADZoaGVhCvgVwgAAAsgAAAAkaG10eCA6AAIAAALsAAAADGxvY2EAAARLAAAC%2BAAAABBtYXhwBIgEWQAAAwgAAAAgbmFtZXHR30MAAAMoAAACOXBvc3QDogHPAAAFZAAAACBwcmVwupWEAAAABYQAAAAHAAAGcgGQAAUAAAgACAAAAAAACAAIAAAAAAAAAQIAAAAAAAAAAAAAAAAAAAAAAAAAAAAAAAAAAAAAACAgICAAAAAo8AMGe%2F57AAAHPgGyAAAAAAACAAEAAQAAABQAAwABAAAAFAAEACgAAAAGAAQAAQACACgAKf%2F%2FAAAAKAAp%2F%2F%2F%2F2f%2FZAAEAAAAAAAAAAAFUAFYBAAAsAKgDgAAyAAcAAAACAAAAKgDVA1UAAwAHAAA1MxEjEyMRM9XVq4CAKgMr%2FQAC1QABAAD%2B0AIgBtAACQBNGAGwChCwA9SwAxCwAtSwChCwBdSwBRCwANSwAxCwBzywAhCwCDwAsAoQsAPUsAMQsAfUsAoQsAXUsAoQsADUsAMQsAI8sAcQsAg8MTAREAEzABEQASMAAZCQ%2FnABkJD%2BcALQ%2FZD%2BcAGQAnACcAGQ%2FnAAAQAA%2FtACIAbQAAkATRgBsAoQsAPUsAMQsALUsAoQsAXUsAUQsADUsAMQsAc8sAIQsAg8ALAKELAD1LADELAH1LAKELAF1LAKELAA1LADELACPLAHELAIPDEwARABIwAREAEzAAIg%2FnCQAZD%2BcJABkALQ%2FZD%2BcAGQAnACcAGQ%2FnAAAQAAAAEAAPW2NYFfDzz1AAMIAP%2F%2F%2F%2F%2FVre7u%2F%2F%2F%2F%2F9Wt7u4AAP7QA7cG0AAAAAoAAgABAAAAAAABAAAHPv5OAAAXcAAA%2F%2F4DtwABAAAAAAAAAAAAAAAAAAAAAwDVAAACIAAAAiAAAAAAAAAAAAAkAAAAowAAASQAAQAAAAMACgACAAAAAAACAIAEAAAAAAAEAABNAAAAAAAAABUBAgAAAAAAAAABAD4AAAAAAAAAAAACAA4APgAAAAAAAAADAFwATAAAAAAAAAAEAD4AqAAAAAAAAAAFABYA5gAAAAAAAAAGAB8A%2FAAAAAAAAAAIABwBGwABAAAAAAABAD4AAAABAAAAAAACAA4APgABAAAAAAADAFwATAABAAAAAAAEAD4AqAABAAAAAAAFABYA5gABAAAAAAAGAB8A%2FAABAAAAAAAIABwBGwADAAEECQABAD4AAAADAAEECQACAA4APgADAAEECQADAFwATAADAAEECQAEAD4AqAADAAEECQAFABYA5gADAAEECQAGAB8A%2FAADAAEECQAIABwBGwBSAG8AdQBuAGQAIABiAHIAYQBjAGsAZQB0AHMAIAB3AGkAdABoACAAYQBzAGMAZQBuAHQAIAAxADgANQA0AFIAZQBnAHUAbABhAHIATQBhAHQAaABzACAARgBvAHIAIABNAG8AcgBlACAAUgBvAHUAbgBkACAAYgByAGEAYwBrAGUAdABzACAAdwBpAHQAaAAgAGEAcwBjAGUAbgB0ACAAMQA4ADUANABSAG8AdQBuAGQAIABiAHIAYQBjAGsAZQB0AHMAIAB3AGkAdABoACAAYQBzAGMAZQBuAHQAIAAxADgANQA0AFYAZQByAHMAaQBvAG4AIAAyAC4AMFJvdW5kX2JyYWNrZXRzX3dpdGhfYXNjZW50XzE4NTQATQBhAHQAaABzACAARgBvAHIAIABNAG8AcgBlAAAAAAMAAAAAAAADnwHPAAAAAAAAAAAAAAAAAAAAAAAAAAC5B%2F8AAY2FAA%3D%3D)format('truetype')%3Bfont-weight%3Anormal%3Bfont-style%3Anormal%3B%7D%3C%2Fstyle%3E%3C%2Fdefs%3E%3Ctext%20font-family%3D%22Arial%22%20font-size%3D%2216%22%20font-style%3D%22italic%22%20text-anchor%3D%22middle%22%20x%3D%225.5%22%20y%3D%2226%22%3EF%3C%2Ftext%3E%3Ctext%20font-family%3D%22round_brackets18549f92a457f2409%22%20font-size%3D%2212%22%20text-anchor%3D%22middle%22%20x%3D%2213.5%22%20y%3D%2232%22%3E(%3C%2Ftext%3E%3Ctext%20font-family%3D%22Arial%22%20font-size%3D%2212%22%20font-style%3D%22italic%22%20text-anchor%3D%22middle%22%20x%3D%2218.5%22%20y%3D%2232%22%3E%26%23x3B1%3B%3C%2Ftext%3E%3Ctext%20font-family%3D%22math16c0457e5337c5b165512367452%22%20font-size%3D%2212%22%20text-anchor%3D%22middle%22%20x%3D%2224.5%22%20y%3D%2232%22%3E%3B%3C%2Ftext%3E%3Ctext%20font-family%3D%22Arial%22%20font-size%3D%2212%22%20font-style%3D%22italic%22%20text-anchor%3D%22middle%22%20x%3D%2232.5%22%20y%3D%2232%22%3Em%3C%2Ftext%3E%3Ctext%20font-family%3D%22math16c0457e5337c5b165512367452%22%20font-size%3D%2212%22%20text-anchor%3D%22middle%22%20x%3D%2240.5%22%20y%3D%2232%22%3E%2C%3C%2Ftext%3E%3Ctext%20font-family%3D%22Arial%22%20font-size%3D%2212%22%20font-style%3D%22italic%22%20text-anchor%3D%22middle%22%20x%3D%2245.5%22%20y%3D%2232%22%3En%3C%2Ftext%3E%3Ctext%20font-family%3D%22round_brackets18549f92a457f2409%22%20font-size%3D%2212%22%20text-anchor%3D%22middle%22%20x%3D%2251.5%22%20y%3D%2232%22%3E)%3C%2Ftext%3E%3Ctext%20font-family%3D%22math16c0457e5337c5b165512367452%22%20font-size%3D%2216%22%20text-anchor%3D%22middle%22%20x%3D%2262.5%22%20y%3D%2226%22%3E%3D%3C%2Ftext%3E%3Cline%20stroke%3D%22%23000000%22%20stroke-linecap%3D%22square%22%20stroke-width%3D%221%22%20x1%3D%2273.5%22%20x2%3D%22149.5%22%20y1%3D%2220.5%22%20y2%3D%2220.5%22%2F%3E%3Ctext%20font-family%3D%22Arial%22%20font-size%3D%2216%22%20text-anchor%3D%22middle%22%20x%3D%22111.5%22%20y%3D%2215%22%3E1%3C%2Ftext%3E%3Ctext%20font-family%3D%22Arial%22%20font-size%3D%2216%22%20font-style%3D%22italic%22%20text-anchor%3D%22middle%22%20x%3D%2280.5%22%20y%3D%2237%22%3EF%3C%2Ftext%3E%3Ctext%20font-family%3D%22round_brackets18549f92a457f2409%22%20font-size%3D%2212%22%20text-anchor%3D%22middle%22%20x%3D%2288.5%22%20y%3D%2243%22%3E(%3C%2Ftext%3E%3Ctext%20font-family%3D%22Arial%22%20font-size%3D%2212%22%20text-anchor%3D%22middle%22%20x%3D%2293.5%22%20y%3D%2243%22%3E1%3C%2Ftext%3E%3Ctext%20font-family%3D%22math16c0457e5337c5b165512367452%22%20font-size%3D%2212%22%20text-anchor%3D%22middle%22%20x%3D%22103.5%22%20y%3D%2243%22%3E%26%23x2212%3B%3C%2Ftext%3E%3Ctext%20font-family%3D%22Arial%22%20font-size%3D%2212%22%20font-style%3D%22italic%22%20text-anchor%3D%22middle%22%20x%3D%22112.5%22%20y%3D%2243%22%3E%26%23x3B1%3B%3C%2Ftext%3E%3Ctext%20font-family%3D%22math16c0457e5337c5b165512367452%22%20font-size%3D%2212%22%20text-anchor%3D%22middle%22%20x%3D%22118.5%22%20y%3D%2243%22%3E%3B%3C%2Ftext%3E%3Ctext%20font-family%3D%22Arial%22%20font-size%3D%2212%22%20font-style%3D%22italic%22%20text-anchor%3D%22middle%22%20x%3D%22124.5%22%20y%3D%2243%22%3En%3C%2Ftext%3E%3Ctext%20font-family%3D%22math16c0457e5337c5b165512367452%22%20font-size%3D%2212%22%20text-anchor%3D%22middle%22%20x%3D%22131.5%22%20y%3D%2243%22%3E%2C%3C%2Ftext%3E%3Ctext%20font-family%3D%22Arial%22%20font-size%3D%2212%22%20font-style%3D%22italic%22%20text-anchor%3D%22middle%22%20x%3D%22138.5%22%20y%3D%2243%22%3Em%3C%2Ftext%3E%3Ctext%20font-family%3D%22round_brackets18549f92a457f2409%22%20font-size%3D%2212%22%20text-anchor%3D%22middle%22%20x%3D%22145.5%22%20y%3D%2243%22%3E)%3C%2Ftext%3E%3C%2Fsvg%3E)
Graph is
1import numpy as np
2import matplotlib.pyplot as plt
3
4# Define parameters
5alpha = np.linspace(0.01, 0.99, 100)  # Generate alpha values
6m = 5  # Choose arbitrary values for m and n
7n = 7
8
9# Calculate F_alpha and F_1-alpha
10F_alpha = 1 / (1 + (m / n) * alpha / (1 - alpha))
11F_1_alpha = 1 / (1 + (n / m) * (1 - alpha) / alpha)
12
13# Plot
14plt.figure(figsize=(10, 6))
15plt.plot(alpha, F_alpha, label=r'$F_{\alpha,m,n}
output is
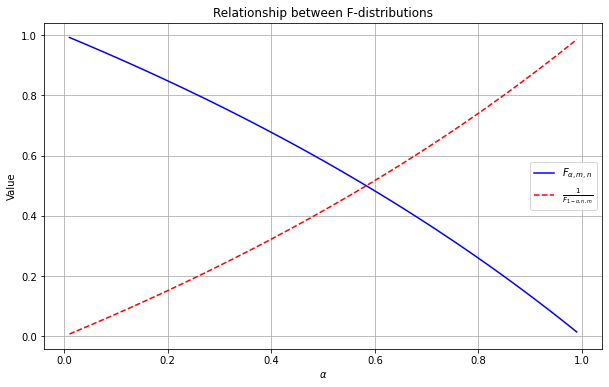
, color='blue')
16plt.plot(alpha, F_1_alpha, label=r'$\frac{1}{{F_{1-\alpha,n,m}}}
output is
, color='red', linestyle='dashed')
17plt.title('Relationship between F-distributions')
18plt.xlabel(r'$\alpha
output is
)
19plt.ylabel('Value')
20plt.legend()
21plt.grid(True)
22plt.show()
output is

Step by step
Solved in 3 steps with 13 images

Recommended textbooks for you
MATLAB: An Introduction with Applications
Statistics
ISBN:
9781119256830
Author:
Amos Gilat
Publisher:
John Wiley & Sons Inc

Probability and Statistics for Engineering and th…
Statistics
ISBN:
9781305251809
Author:
Jay L. Devore
Publisher:
Cengage Learning

Statistics for The Behavioral Sciences (MindTap C…
Statistics
ISBN:
9781305504912
Author:
Frederick J Gravetter, Larry B. Wallnau
Publisher:
Cengage Learning
MATLAB: An Introduction with Applications
Statistics
ISBN:
9781119256830
Author:
Amos Gilat
Publisher:
John Wiley & Sons Inc
Probability and Statistics for Engineering and th…
Statistics
ISBN:
9781305251809
Author:
Jay L. Devore
Publisher:
Cengage Learning
Statistics for The Behavioral Sciences (MindTap C…
Statistics
ISBN:
9781305504912
Author:
Frederick J Gravetter, Larry B. Wallnau
Publisher:
Cengage Learning

Elementary Statistics: Picturing the World (7th E…
Statistics
ISBN:
9780134683416
Author:
Ron Larson, Betsy Farber
Publisher:
PEARSON

The Basic Practice of Statistics
Statistics
ISBN:
9781319042578
Author:
David S. Moore, William I. Notz, Michael A. Fligner
Publisher:
W. H. Freeman

Introduction to the Practice of Statistics
Statistics
ISBN:
9781319013387
Author:
David S. Moore, George P. McCabe, Bruce A. Craig
Publisher:
W. H. Freeman