I want an answer of question number 2.
![Let f(x) = Vsin x. Compute the midpoint sum for f
corresponding to the partition of [0, 2] into 20 intervals
of equal length.](/v2/_next/image?url=https%3A%2F%2Fcontent.bartleby.com%2Fqna-images%2Fquestion%2F1974f639-b7c8-43df-92b8-417d565eba23%2F77e3ebb9-066c-40ca-a134-0956012ddfbc%2Ftnvsl1c.png&w=3840&q=75)
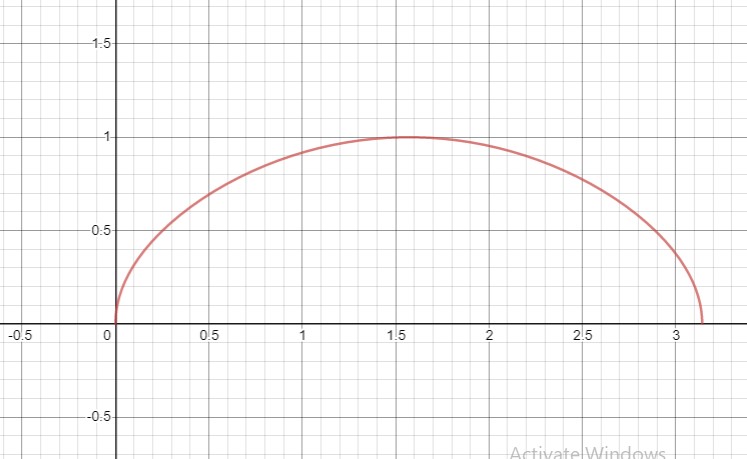
Draw the graph of the function  .
.

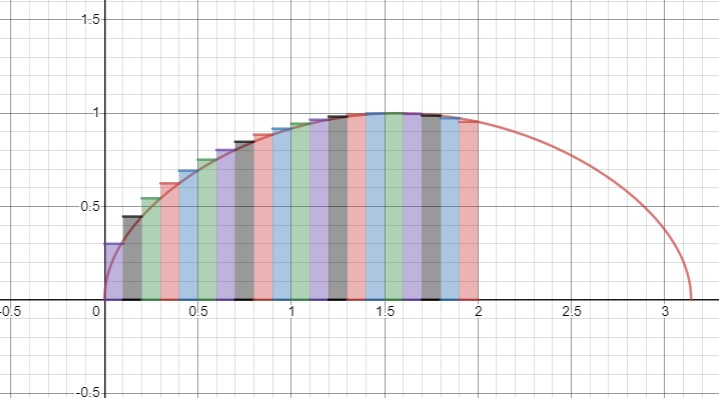
To find the midpoint sum of f corresponding to the interval [0,2], subdivide the area under the graph in the interval [0,2] into 20 rectangles of equal width that is 0.1 .

Set  .
.
Mid-point of line between interval [0,0.1] =
Substitute the value of mid-point in the function f(x) and find the value of y.

Area under the interval [0,0.1] =
Mid-point of line between interval [0.1,0.2] =
Substitute the value of mid-point in the function f(x) and find the value of y.

Area under the interval [0.1,0.2] =

Mid-point of line between interval [0.2,0.3] =
Substitute the value of mid-point in the function f(x) and find the value of y.

Area under the interval [0.2,0.3] =
Mid-point of line between interval [0.3,0.4] =
Substitute the value of mid-point in the function f(x) and find the value of y.

Area under the interval [0.3,0.4] =
Mid-point of line between interval [0.4,0.5] =
Substitute the value of mid-point in the function f(x) and find the value of y.

Area under the interval [0.4,0.5] =
Mid-point of line between interval [0.5,0.6] =
Substitute the value of mid-point in the function f(x) and find the value of y.

Area under the interval [0.5,0.6] =
Mid-point of line between interval [0.6,0.7]=
Substitute the value of mid-point in the function f(x) and find the value of y.

Area under the interval [0.6,0.7] =
Step by step
Solved in 9 steps with 64 images


