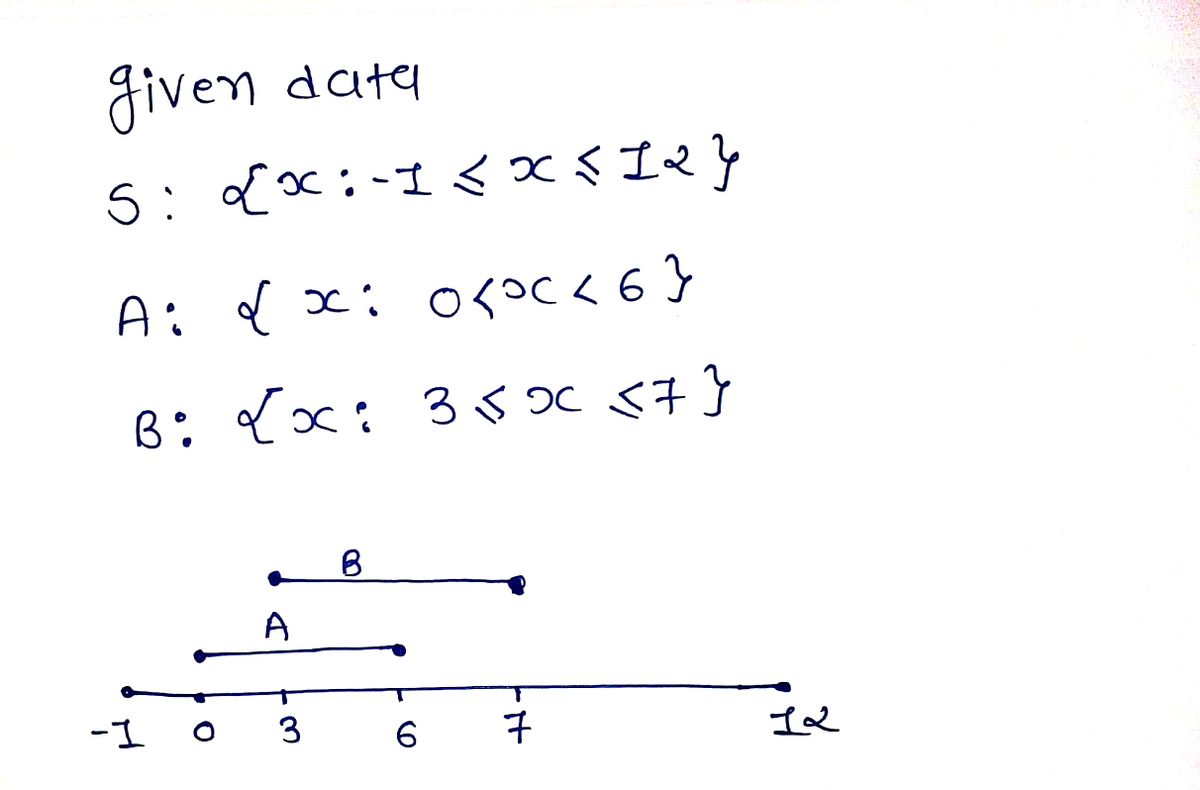
Let events A and B and sample space S be defined as the following intervals: S = {x: -1 ≤ x ≤ 12} A = {x: 0 < x < 6} B = {x: 3 ≤ x ≤ 7} Characterize the following events: a) An B b) AU B c) An BC
Q: The acceptable level for insect filth in a certain food item is 44 insect fragments (larvae, eggs,…
A: Let's go through the given information and the steps to analyze this data.Explanation:### Given…
Q: The average number of children a Japanese woman has in her lifetime is 1.38. Suppose that one…
A:
Q: Suppose duration of pregnancy has a mean of 266 days and a standard deviation of 16 days. Use…
A: (a)The proportion of pregnancies lasting between 250 days and 282 days is,
Q: Let x be . Is x a discrete or continuous random variable?the cubic feet of space within a vehicle…
A: Find the nature of variable x.
Q: A running coach wants to know if participating in weekly running clubs significantly improves the…
A: Option a) is correct.
Q: In a big university with over 10,000 students, 20% of all students work full time. A random sample…
A:
Q: A probability distribution has a mean of 12 and a standard deviation of 1/3. Use Chebyshev’s…
A: From the provided information,
Q: a) b) what percentage of the observation are between 10 and 30 Between 。 and 40 Between -20 and 60…
A: Step 1: Step 2: Step 3: Step 4:
Q: A probability distribution has a mean of 12 and a standard deviation of 1/3. Use Chebyshev’s…
A: Population mean μ = 12 Population standard deviation σ = 1/3We know that from Chebychev’s…
Q: following table. Procurement Cost($) 10 11 12 on is Probability 0.25 0.45 0.30 Labor Cost ($) 20 22…
A: Given data: Procurement cost Probability Labor cost Probability Transportation cost Probability…
Q: Assume a member is selected at random from the population represented by the graph. Find the…
A:
Q: Find the standard deviati on, o, for the binomial distribution which has the stated values of n and…
A: From the provided information, Sample size (n) = 20 Probability (p) = 0.4
Q: In a survey of 3,800 adults concerning complaints about restaurants, 1,456 complained about dirty or…
A: Given that Sample size n =3800 Favorable cases x =1456 , for about dirty. Sample proportion p^=x/n…
Q: 38 40 42 44 46 48 50 52 54 56 58 60 62
A: Solution-: From given normal curve we get, and (i) The mean time to complete the course is equal…
Q: 3.3-2. If Z is N(0, 1), find (a) P(0 ≤ Z≤ 0.78). (c) P(-2.31 ≤ Z-0.65). (e) P(Z 2). (b) P(-2.46 ≤ Z…
A: Absolut values inequalities : 1) If |a|<b then -a < b < a 2) if |a|>b then…
Q: Let X denote that number of years I will use my current computer, and Y the number of years that I…
A: X 1 2 3 Total Y 1 0.05 0.16 0.19 0.4 2 0.10 0.13 0.12 0.35 3 0.07 0.10 0.08 0.25 Total…
Q: a) In a data distribution, the value of the second quartile (Q2) is always equal of the average. b)…
A: Note: Hey there! Thank you for the question. We have treated the question as a multiple-choice type…
Q: a. Obtain the cdf of X. b. What is P(X ≤ .5)? c. Using the cdf from (a), what is P(.25 < X ≤ .5)?…
A: we have the pdf, f(x) = 90x8(1-x)= 90(x8-x9) for 0<x<1 we want to find, a. Obtain the cdf of…
Q: ) Identify the distribution O Find p(x-17) Find p(x>20)
A: According to our guidelines we are solving only first three sub-parts of a question and the rest…
Q: A group of students on a Mathematics for Economics course were surveyed to see how long they spent…
A: For grouped data, the frequency corresponding to a class is the number of observation occurring in…
Q: The manager of a local bank observes how long it takes a customer to complete his transactions at…
A: Probability is a branch of mathematics or statistics which basically deals with the chances of…
Step by step
Solved in 2 steps with 2 images
- Let X be the number of blueberries on a muffin made by Michael, and denote by m to be its median. Charles suspects that Michael has been adding more blueberries than usual to his muffins. For some reason, he has kept meticulous records. The last 15 muffins Charles bought contained the following numbers of blueberries: 96 12 8 15 7 8 12 6 10 13 11 11 10 10 Charles would like to test Ho: m = 9 against H₁: m>9 at significance level a = 0.1. (a) Use the sign test to test the hypothesis. (b) Use the Wilcoxon sign-rank test to test the hypothesis. (Note: Assume that the distribution is continuous) (c) Use the t-test to test the hypothesis, assuming the underlying distribution is symmetric.can you solve this for me by showing step by step for each question? Acme Food manufactures and sells bags of doughnuts whose weights follow a normal distribution with a mean of 400g and standard deviation 8g. a) Find the probability that a bag of doughnuts weights less than 410g b) Find P (X>412) c) Find P (395 < X < 404) d) The company can be prosecuted if the bags are less than 380g, if the company sells 50 bags per day find the expected number of bags under this weight. e) On a typical day 1.22% of bags are rejected as they are too heavy. Find the rejection weight.Consider ratings of 4 “Agree” or 5 “Strongly Agree” to mean that test takers have obtained a “high” score on a BRS item. Ratings of 1-3 would be considered “low” item scores. Compute the item discrimination index (d) for BRS Item 3. Enter the values below that you obtain from Excel: Total # of test takers N = _______ 25% of the total # of test takers, or # in the Upper 25% group U = _______ # of test takers in the Upper 25% group for BRS total scores who scored high on item 3 = _______ # of test takers in the Lower 25% group for BRS total scores who scored high on item 3 = _______ Item discrimination index d = ________ ID # Item 1 Item 2 Item 3 Item 4 Item 5 Item 6 BRS Total Score 25 5 5 5 5 5 5 55 24 5 5 2 4 5 5 50 21 5 4 5 3 5 5 48 22 5 5 4 3 3 4 46 23 5 3 3 5 5 2 46 18 4 5 5 4 4 4 44 20 5 5 4 3 3 4 44 16 5 4 5 5 4 3 42 19 4 5 4 1…
- D5) X and Y are two points that are selected according to a uniform distribution. Calculate the expected value of the distance between these two points for each of the following cases: a) Both X and Y are selected independently from the range 0-1. b) We select X between 0 and 1 and then select Y between 0 and X. Note: For case b the distance is equal to |Y-X|n a big university with over 10,000 students, 20% of all students work full time. A random sample of 100 students is selected from the university. Let X denote the number of students who work full time in the sample. b) Find ?(? = 20) c) Find ?(? ≤ 20) d) Find ?(? ≥ 20) Can you explain how you got them using work?Assume that the height, X, of a college woman is a normally distributed random variable with a mean of 65 inches and a standard deviation of 3 inches. Suppose that we sample the heights of 180 randomly chosen college women. Let M be the sample mean of the 180 height measurements. Let S be the sum of the 180 height measurements. All measurements are in inches. Using R and write the code out.a) What is the probability that X < 59? b) What is the probability that X > 59? c) What is the probability that all of the 180 measurements are greater than 59? d) What is the expected value of S? e) What is the standard deviation of S? f) What is the probability that S-180*65 >10? g) What is the standard deviation of S-180*65 h) What is the expected value of M? i) What is the standard deviation of M? j) What is the probability that M >65.41? k) What is the standard deviation of 180*M? l) If the probability of X > k is equal to .3, then what is k?