Lake Quanipaug in Connecticut is famous for its yellow perch. Studies have found that the national mean length is µ = 8.2 inches. However, a random sample of 31 fish caught during Memorial weekend at Lake Quanipaug, had a sample mean of x̄=7.1 inches, with an estimated sample standard deviation of s = 3.8 inches. Do these current data indicate that the average length of the yellow caught at Lake Quanipaug is less than historical µ = 8.2 inches? Use α = .02. State α, Ho, H1, p-value, rejection, or non-rejection, and be certain to interpret your results.


Lake Quanipaug in Connecticut is famous for its yellow perch. Studies have found that the national
State α, Ho, H1, p-value, rejection, or non-rejection, and be certain to interpret your results.
Here, the level of significance, α = .02.
H0: µ =8.2 inches (That is, the true average length of the yellow caught at Lake Quanipaug is 8.2 inches.)
H1: µ< 8.2 (the true average length of the yellow caught at Lake Quanipaug is less than 8.2 inches.)
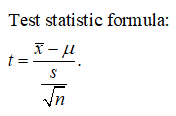
Computation of test statistic value:
Sample size is smaller than 30 and the population standard deviation is unknown. Thus, in order to test vs, the appropriate test is one sample t test. The formula for one sample t test is given below.
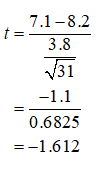
Calculation:
It is known that the sample mean, x-bar = 7.1 inches, and sample standard deviation, s= 3.8 inches, µ = 8.2, and n is 31. By substituting these values in t formula, the test statistic value will be obtained as given below:
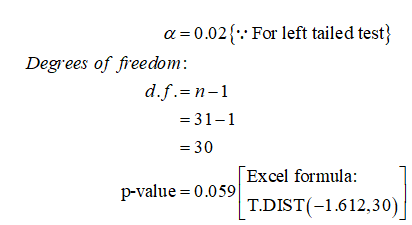
Obtain the p-value:
Consider that the level of significance is α = 0.02.
The p-value corresponding to the given situation is obtained from the calculation given below:

Step by step
Solved in 3 steps with 3 images


