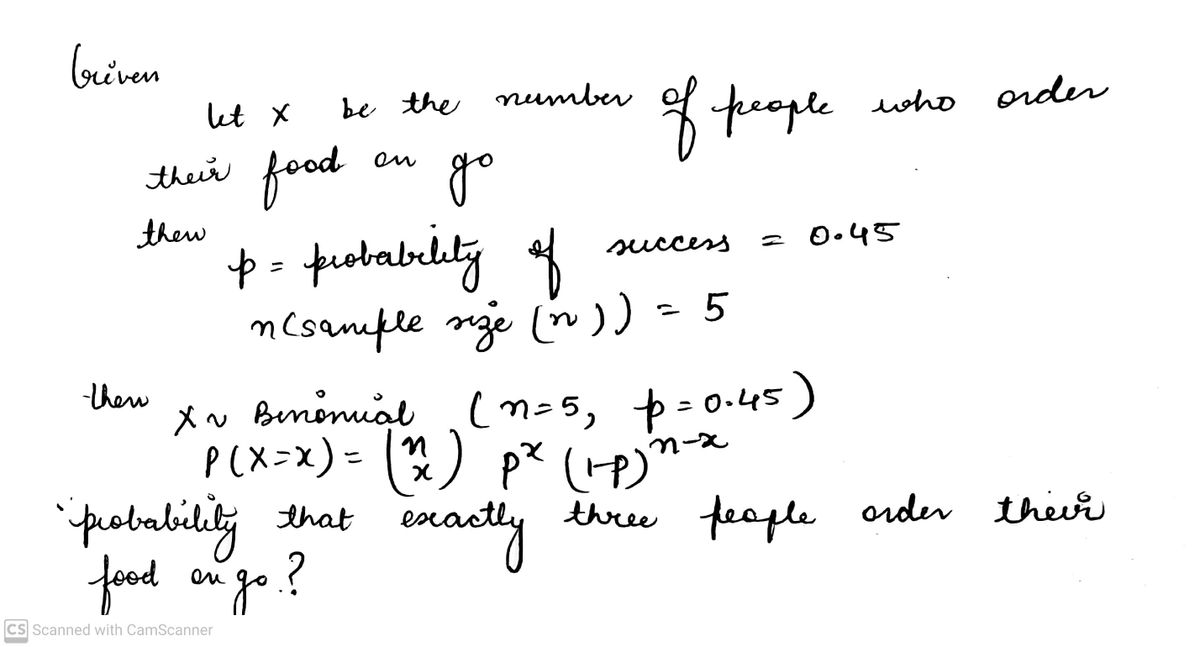
Juanita's, a fast-food chain specializing in hot dogs and garlic fries, keeps track of the proportion of its customers who decide to eat in the restaurant (as opposed to ordering the food "to go"), so it can make decisions regarding the possible construction of in-store play areas, the attendance of its mascot Bruno at the franchise locations, and so on. Juanita's reports that 45% of its customers order their food to go. If this proportion is correct, what is the probability that, in a random sample of 5 customers at Juanita's, exactly 3 order their food to go? Round your response to at least three decimal places.
Q: A company is analyzing the data of two branches located in different cities. Part of reviewing the…
A:
Q: In a medical study, two groups had the following summary statistics regarding their heights. Group…
A: From the given information, the sample mean for Group A is 168.3 and the sample mean for Group B is…
Q: Methadone is a synthetic drug whose effect on the body is similar to that of morphine and heroin.…
A: From the given histogram, Class range frequency 0-50 6 50-100 12 100-150 10 150-200 6…
Q: A large industrial firm uses three local motels to provide overnight accommodations for its clients.…
A: Given Information: 20% of the clients are assigned rooms at Ramada Inn, where plumbing is faulty in…
Q: You're a data analyst for an insurance company. You want to make sure that your employer is not…
A: The data given relates to the amount of repairs required by 42 cars and cost incurred in two…
Q: foreclosures handled by your firm in each of the months shown.
A:
Q: For a group of children’s sports teams, we want children with a lot of experience, some experience…
A: It is needed to test the whether the team has the same proportion of children with a lot, some or no…
Q: Despite the availability of several modes of transportation, including metro and ride-booking…
A: It is given that, 62% of area adults use their own cars daily. Let A represents the area adults use…
Q: You're a data analyst for an insurance company. You want to make sure that your employer is not…
A: Given information: The data for the charges for 31 cars by Bubba's Hubcap Heaven and Repair, and…
Q: Juanita's, a fast-food chain specializing in hot dogs and garlic fries, keeps track of the…
A: Given,n=5p=0.52q=1-pq=1-0.52=0.48A random variable X~Binomial(n=5 , p=0.52)P(X=x)=5x 0.52x 0.485-x ;…
Q: As the price of oil rises, there is increased worldwide interest in alternate sources of energy. The…
A: We have to find sample size and test hypothesis
Q: This question is based on the following table, which shows the number of foreclosures in three…
A: Number of foreclosures in each of the months:June: 8,510July: 8,865August: 9,140 Explanation:We…
Q: Gulf Real Estate Properties Gulf Real Estate Properties, Inc., is a real estate firm located in…
A: Gulf View CondominiumsNo Gulf View CondominiumsList priceSale priceDays to sellList priceSale…
Q: An apartment management company wants to explore the consequences of allowing residents to have…
A: The data for predicting the resident rating given the data for number of dogs and years of facility…
Q: When 20 employees were first hired in 2011 for a creative engineering firm, Company A, the starting…
A:
Q: Maci is a social networking maniac! Although she prefers Instagram, she also spends a lot of time…
A: Introduction A variable is a no., characteristic which can be counted or measured.
Q: One game at a carnival is called “Duck Pond.” This game consists of a large number of ducks that are…
A:
Q: The source table depicts the results of a fictional study investigating whether the number of hours…
A: Find the sample size for the entire study. From the information, the degrees of freedom for gender…
Q: Ed's Tires and Brakes has two locations, one on the northwest side of town and one on the southeast…
A:
Q: In a 2015 nationally-representative sample of youth in grades 9-12: 22.6% reported being in a…
A: There are two type of way to summarize the data set. They are descriptive method and inferential…
Q: Read the scenario below to determine which one of the three factors that influence reliability…
A: In educational assessment, reliability refers to the consistency and dependability of the test…
Q: A health researcher studying child birth is interested in the possible effect that smoking by the…
A: Introduction Statistics is a discipline which involves collection, arrangement and analysis of the…
Step by step
Solved in 2 steps with 2 images
- nita's, a fast-food chain specializing in hot dogs and garlic fries, keeps track of the proportion of its customers who decide to eat in the restaurant (as opposed to ordering the food "to go"), so it can make decisions regarding the possible construction of in-store play areas, the attendance of its mascot Sammy at the franchise locations, and so on. Anita's reports that 48% of its customers order their food to go. If this proportion is correct, what is the probability that, in a random sample of 4 customers at Anita's, exactly 3 order their food to go? Round your response to at least three decimal places.Anita's, a fast-food chain specializing in hot dogs and garlic fries, keeps track of the proportion of its customers who decide to eat in the restaurant (as opposed to ordering the food "to go"), so it can make decisions regarding the possible construction of in-store play areas, the attendance of its mascot Sammy at the franchise locations, and so on. Anita's reports that 48% of its customers order their food to go. If this proportion is correct, what is the probability that, in a random sample of 4 customers at Anita's, exactly 3 order their food to go? Round your response to at least three decimal places. (If necessary, consult a list of formulas.) П xThe source depicts the results of a fictional study investigating whether the number of hours of sleep a person gets varies with his or her gender(male,female) and with the number of energy drinks that he or she consumes in a day. Equal numbers of men and women were randomly assigned to drink either 0, 1, or 2 energy drinks during the course of a day and then record the number of hours they slept that night. Table: Coffee and Sleep Source SS df MS F Gender 0.250 1 0.250 0.283 Energy Drinks 81.556 2 40.778 46.180 Gender X Drinks 2.667 2 1.330 1.510 Within…
- Would you like a cup of tea? Carole and Julius are getting ready to open a new cafe and are gathering up information about sales of different drinks in their state. They obtain data containing the yearly sales (in $1000s) for three types of tea: Darjeeling, Earl Grey, and Green Tea. A boxplot of the data and a histogram of the sales for all three teas combined is shown below. Note: Clicking on any image in this problem will open it in a new window, allowing you to enlarge the view. Tea Sales by Product Combined Tea Sales Darjeeling Earl Grey Green Tea 100 200 300 400 Product Sales in $1000 Part 1: Use the plots above to make quantitative comparisons and answer the following questions: Quantity A: The 75th percentile (Q3) of Sales for Darjeeling Tea Quantity B: The 75th percentile (Q3) of Sales for Green Tea Quantity A is greater 008 007 Frequency 00z 001 Sales in $1000An apartment management company wants to explore the consequences of allowing residents to have multiple dogs. They would like to find out whether the number of dogs predicts resident ratings. They would also like to control for the year the apartment complex was built because that might also affect the resident rating. They have collected data on several of their existing complexes. For each complex, they have counted the number of dogs currently living in the complex, the year the complex was built, and the average rating for that particular complex. They would like to perform a multiple regression on these variables to predict resident ratings. See data below. These data are the same as the previous question. Positive and Negative Dog Ratings Number of dogs Year of facility Rating (out of 5) 54 1975 2 31 1964 3.5 0 2015 4.8 11 2011 3.8 73 1964 2.3 23 2016 3.7 0 2015 4.7 49 1989 2.7 What can we conclude about this multiple regression analysis? Fill in the…The United Nations Human Development Report gives the following data for real GDP per person in 2018: China, $15,270; Russia, $24,233; Canada, $43,433; United States, $54,941. Life expectancy at birth is 79.3 in Canada, 78.8 in the United States, 76.6 in China, and 72.3 in Russia. Freedom House rates political freedom each year, and its ratings are as follows: Canada, 1.0; the United States, 1.5; Russia, 6.5; and China, 6.5 ((1.0 is the most free and 7.0 is the least free). How do life expectancy at birth and political freedom change the relative ranking of living standards that real GDP per person indicate? A. They don't change the relative ranking because they rank countries in a similar way as real GDP per person ranks them. B. They completely reverse the relative ranking because they rank countries exactly opposite to the way that real GDP per person ranks them. C. They don't change the relative ranking of Canada and the United…
- Ed's Tires and Brakes has two locations, one on the northwest side of town and one on the southeast side of town. At both locations are performed routine tire repairs and rotations, as well as expensive brake repairs. This past week, 30% of the cars serviced at Ed's were serviced at the northwest location, while 70% of the cars were serviced at the southeast location. (No car was serviced at both locations.) Brake repairs were more typical at the northwest location than at the southeast location: 50% of the cars at the northwest location required brake repairs, while 25% of the cars at the southeast location required brake repairs. Let N denote the event that a randomly chosen car (taken to Ed's in the past week) was serviced at the northwest location and N denote the event that a randomly chosen car was serviced at the southeast location. Let B denote the event that a randomly chosen car required brake repairs and B denote the event that a randomly chosen car did not require brake…A gym wishes to evaluate the effectiveness of its programs. When a new member joins the gym, they meet with a trainer who designs a recommended routine based on the member’s current fitness and their goals. The recommended routines can be classified into high, medium, or low effort. Historically, 68% of the new members get a high effort routine, 21% get a medium effort routine, and the rest get a low effort routine. After the first six months as members, the gym surveys the members’ adherence to the recommended routine. The gym classifies a member’s performance as optimal if they follow the recommended routine for the six months, or as inferior otherwise. According to the historical results of the survey, 84% of the members with a low effort routine, 22% of the members with a medium effort routine, and 69% of the members with a high effort routine report optimal performance. After the first six months of joining the gym, a member can obtain different results: they can either…Would you like a cup of tea? Carole and Julius are getting ready to open a new cafe and are gathering up information about sales of different drinks in their state. They obtain data containing the yearly sales (in $1000s) for three types of tea: Darjeeling, Earl Grey, and Green Tea. A boxplot of the data and a histogram of the sales for all three teas combined is shown below. Note: Clicking on any image in this problem will open it in a new window, allowing you to enlarge the view. Tea Sales by Product Combined Tea Sales Darjeeling Earl Grey Green Tea 100 200 300 400 Product Sales in $1000 Part 1: Use the plots above to make quantitative comparisons and answer the following questions: Quantity A: The 75th percentile (Q3) of Sales for Darjeeling Tea Quantity B: The 75th percentile (Q3) of Sales for Green Tea Quantity A is greater Quantity A: The median of Sales for Darjeeling Tea Quantity B: The median of Sales for Green Tea Quantity B is greater 00€ 007 Frequency > 000 008 007 Sales in…
- The Bureau of Transportation reports on-time performance for airlines at major airports. JetBlue, United, and US Airways share Terminal C and Boston's Logan Airport. The percentage of on-time flights reported for a sample month were 76.8% for JetBlue, 71.5% for United, and 82.2% for US Airways. Assume that 30% of the arriving flights at this terminal are JetBlue flights, 32% are United flights, and 38% are US Airways flights. a. Develop a contingency table (table of joint probabilities and marginal probabilities). b. An announcement is made that Flight 1382 will arrive at Terminal C. What is the probability that the flight will arrive on time? c. Flight 1382 arrives on time. What is the probability that Flight 1382 is operated by US Airways? d. Flight 1382 will not arrive on time. What is the probability that Flight 1382 is operated by United?Practice question #1. Researchers at the University of Utah carried out a study to see if the size of the fork used to eat dinner influences how much food is consumed. The researchers assigned people to one of two groups. One group ate dinner using a small fork, and the other group ate using a large fork. The researchers found that thatthose who ate with a large fork ate less food on their plate than those who ate with a small fork. An articledescribing this study was called “Dieters Should Use a Big Fork”, implying cause-and-affect andgeneralizing this finding to the population of dieters. A. Under what circumstances would it be reasonable to conclude a cause-and-effect relationship between fork size and amount eaten? B. Under what circumstances would it be reasonable to generalize this finding to the population of dieters? Why is it often NOT appropriate to generalize the results of experiments to a wider population?Ed's Tires and Brakes has two locations, one on the northwest side of town and one on the southeast side of town. At both locations are performed routine tire repairs and rotations, as well as expensive brake repairs. This past week, 40% of the cars serviced at Ed's were serviced at the northwest location, while 60% of the cars were serviced at the southeast location. (No car was serviced at both locations.) Brake repairs were more typical at the northwest location than at the southeast location: 50% of the cars at the northwest location required brake repairs, while 25% of the cars at the southeast location required brake repairs. Let N denote the event that a randomly chasen car (taken to Ed's in the past week) was serviced at the northwest location and N denote the event that a randomly chosen car was serviced at the southeast location. Let B denote the event that a randomly chosen car required brake repairs and B denote the event that a randomly chosen car did not require brake…