Joan was convinced that students who study abroad during college would report a more positive “college experience” than the general population of students, whose average “college experience” is m = 4.5 on a scale ranging from 1, totally negative, to 7, extremely positive). She sampled 7 students who had studied abroad. Their scores are as follows: X 4 6 7 7 6 5 7 *For this problem, you will be conducting a t test for a single sample. See pages 235-237 for an example of conducting this type of analysis and model your response after that problem ) Step 3: What is the critical value for this test at alpha = .05 (i.e., significance level of 5%)?
Joan was convinced that students who study abroad during college would report a more positive “college experience” than the general population of students, whose average “college experience” is m = 4.5 on a scale ranging from 1, totally negative, to 7, extremely positive). She sampled 7 students who had studied abroad. Their scores are as follows: X 4 6 7 7 6 5 7 *For this problem, you will be conducting a t test for a single sample. See pages 235-237 for an example of conducting this type of analysis and model your response after that problem ) Step 3: What is the critical value for this test at alpha = .05 (i.e., significance level of 5%)?

MATLAB: An Introduction with Applications
6th Edition
ISBN:9781119256830
Author:Amos Gilat
Publisher:Amos Gilat
Chapter1: Starting With Matlab
Section: Chapter Questions
Problem 1P

Related questions
Topic Video
Question
- Joan was convinced that students who study abroad during college would report a more positive “college experience” than the general population of students, whose average “college experience” is m = 4.5 on a scale
ranging from 1, totally negative, to 7, extremely positive). She sampled 7 students who had studied abroad. Their scores are as follows:
X
4
6
7
7
6
5
7
*For this problem, you will be conducting a t test for a single sample. See pages 235-237 for an example of conducting this type of analysis and model your response after that problem
) Step 3: What is the critical value for this test at alpha = .05 (i.e., significance level of 5%)?
Expert Solution
Step 1
Hypothesis:
Step-by-step procedure to obtain the mean and the standard deviation using Excel is given below:
- In Excel sheet, enter Scores X in one column.
- In Data, select Data Analysis and choose Descriptive statistics.
- In Input Variable Range, select Scores X.
- Select Summary Statistics.
- Click Labels.
- Click Ok.
Output obtained using the Excel is given below:
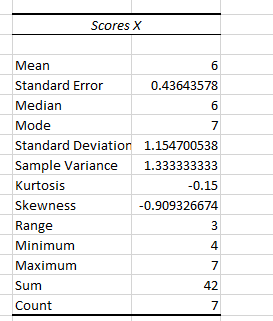
From the output, the sample mean is 6 and standard deviation is 1.15.

Step by step
Solved in 4 steps with 2 images

Knowledge Booster


Learn more about
Need a deep-dive on the concept behind this application? Look no further. Learn more about this topic, statistics and related others by exploring similar questions and additional content below.Recommended textbooks for you
MATLAB: An Introduction with Applications
Statistics
ISBN:
9781119256830
Author:
Amos Gilat
Publisher:
John Wiley & Sons Inc

Probability and Statistics for Engineering and th…
Statistics
ISBN:
9781305251809
Author:
Jay L. Devore
Publisher:
Cengage Learning

Statistics for The Behavioral Sciences (MindTap C…
Statistics
ISBN:
9781305504912
Author:
Frederick J Gravetter, Larry B. Wallnau
Publisher:
Cengage Learning
MATLAB: An Introduction with Applications
Statistics
ISBN:
9781119256830
Author:
Amos Gilat
Publisher:
John Wiley & Sons Inc
Probability and Statistics for Engineering and th…
Statistics
ISBN:
9781305251809
Author:
Jay L. Devore
Publisher:
Cengage Learning
Statistics for The Behavioral Sciences (MindTap C…
Statistics
ISBN:
9781305504912
Author:
Frederick J Gravetter, Larry B. Wallnau
Publisher:
Cengage Learning

Elementary Statistics: Picturing the World (7th E…
Statistics
ISBN:
9780134683416
Author:
Ron Larson, Betsy Farber
Publisher:
PEARSON

The Basic Practice of Statistics
Statistics
ISBN:
9781319042578
Author:
David S. Moore, William I. Notz, Michael A. Fligner
Publisher:
W. H. Freeman

Introduction to the Practice of Statistics
Statistics
ISBN:
9781319013387
Author:
David S. Moore, George P. McCabe, Bruce A. Craig
Publisher:
W. H. Freeman