istribution table Area to the Right of the Critical V 0.995 0.99 0.975 0.95 0.90 0.10 0.001 0.004 0.016 2.706 0.010 0.020 0.051 0.103 0.211 4.605 0.072 0.115 0.216 0.352 0.584 6.251 0.207 0.297 0.484 0.711 1.064 7.779 0.412 0.554 0.831 1.145 1.610 9.236 0.676 0.872 1.237 1.635 2.204 10.645 0.989 1.239 1.690 2.167 2.833 12.017 1.344 1.646 2.180 2.733 3.490 13.362 1.735 2.088 2.700 3.325 4.168 14.684 2.156 2.558 3.247 3.940 4.865 15.987 Print Done
istribution table Area to the Right of the Critical V 0.995 0.99 0.975 0.95 0.90 0.10 0.001 0.004 0.016 2.706 0.010 0.020 0.051 0.103 0.211 4.605 0.072 0.115 0.216 0.352 0.584 6.251 0.207 0.297 0.484 0.711 1.064 7.779 0.412 0.554 0.831 1.145 1.610 9.236 0.676 0.872 1.237 1.635 2.204 10.645 0.989 1.239 1.690 2.167 2.833 12.017 1.344 1.646 2.180 2.733 3.490 13.362 1.735 2.088 2.700 3.325 4.168 14.684 2.156 2.558 3.247 3.940 4.865 15.987 Print Done

MATLAB: An Introduction with Applications
6th Edition
ISBN:9781119256830
Author:Amos Gilat
Publisher:Amos Gilat
Chapter1: Starting With Matlab
Section: Chapter Questions
Problem 1P

Related questions
Topic Video
Question

Transcribed Image Text:Conduct the hypothesis test and provide the test statistic, critical value and P-value, and state the conclusion.
A person purchased a slot machine and tested it by playing it 1,255 times. There are 10 different categories of outcomes, including no win, win jackpot, win with three bells, and so on.
When testing the claim that the observed outcomes agree with the expected frequencies, the author obtained a test statistic of x2 = 10.512. Use a 0.10 significance level to test the
claim that the actual outcomes agree with the expected frequencies. Does the slot machine appear to be functioning as expected?
Click here to view the chi-square distribution table.
The test statistic is
(Type an integer or a decimal.)
i Chi-square distribution table
Area to the Right of the Critical V
Degrees of
Freedom
0.995
0.99
0.975
0.95
0.90
0.10
1
0.001
0.004
0.016
2.706
0.010
0.020
0.051
0.103
0.211
4.605
3
0.072
0.115
0.216
0.352
0.584
6.251
0.207
0.297
0.484
0.711
1.064
7.779
5
0.412
0.554
0.831
1.145
1.610
9.236
6
0.676
0.872
1.237
1.635
2.204
10.645
7
0.989
1.239
1.690
2.167
2.833
12.017
8
1.344
1.646
2.180
2.733
3.490
13.362
9.
1.735
2.088
2.700
3.325
4.168
14.684
10
2.156
2.558
3.247
3.940
4.865
15.987
Print
Done
Enter your answer in the answer box and then click Che
Expert Solution
Step 1
The test statistic is,

The sample size is, n=10
The degrees of freedom is,
df=n-1=10-1=9
The level of significance is,

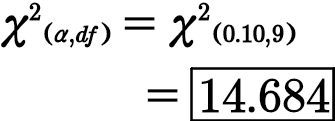
Critical value:
From chi square table with 9 degrees of freedom at 0.10 level of significance the right-tailed critical value is,

Step by step
Solved in 3 steps with 4 images

Knowledge Booster


Learn more about
Need a deep-dive on the concept behind this application? Look no further. Learn more about this topic, statistics and related others by exploring similar questions and additional content below.Recommended textbooks for you
MATLAB: An Introduction with Applications
Statistics
ISBN:
9781119256830
Author:
Amos Gilat
Publisher:
John Wiley & Sons Inc

Probability and Statistics for Engineering and th…
Statistics
ISBN:
9781305251809
Author:
Jay L. Devore
Publisher:
Cengage Learning

Statistics for The Behavioral Sciences (MindTap C…
Statistics
ISBN:
9781305504912
Author:
Frederick J Gravetter, Larry B. Wallnau
Publisher:
Cengage Learning
MATLAB: An Introduction with Applications
Statistics
ISBN:
9781119256830
Author:
Amos Gilat
Publisher:
John Wiley & Sons Inc
Probability and Statistics for Engineering and th…
Statistics
ISBN:
9781305251809
Author:
Jay L. Devore
Publisher:
Cengage Learning
Statistics for The Behavioral Sciences (MindTap C…
Statistics
ISBN:
9781305504912
Author:
Frederick J Gravetter, Larry B. Wallnau
Publisher:
Cengage Learning

Elementary Statistics: Picturing the World (7th E…
Statistics
ISBN:
9780134683416
Author:
Ron Larson, Betsy Farber
Publisher:
PEARSON

The Basic Practice of Statistics
Statistics
ISBN:
9781319042578
Author:
David S. Moore, William I. Notz, Michael A. Fligner
Publisher:
W. H. Freeman

Introduction to the Practice of Statistics
Statistics
ISBN:
9781319013387
Author:
David S. Moore, George P. McCabe, Bruce A. Craig
Publisher:
W. H. Freeman