insider the following sample of observations on coating thickness for low-viscosity paint. 0.83 1.42 0.88 0.88 1.04 1.09 1.17 1.29 1.31 1.49 1.59 1.62 1.65 1.71 1.76 1.83 USE SALT Assume that the distribution of coating thickness is normal (a normal probability plot strongly supports this assumption). (a) Calculate a point estimate of the mean value of coating thickness. (Round your answer to four decimal places.) 1.3475 ✓ State which estimator you used. O p Os Os/x x Ox (b) Calculate a point estimate of the median of the coating thickness distribution. (Round your answer to four decimal places.) 1.365 State which estimator you used and which estimator you might have used instead. (Select all that apply.) Os X Ор Os/x ✔x (c) Calculate a point estimate of the value that separates the largest 10% of all values in the thickness distribution from the remaining 90%. [Hint: Express what you are trying to estimate in terms of u and o.] (Round your answer to four decimal places.) 0.9096 X Ox State which estimator you used. O x O10th percentile O90th percentile (d) Estimate P(X < 1.5), i.e., the proportion of all thickness values less than 1.5. [Hint: If you knew the values of μ and o, you could calculate this probability. These values are not available, but they can be estimated.] (Round your answer to four decimal places.) 0.4286 x (e) What is the estimated standard error of the estimator that you used in part (b)? (Round your answer to four decimal places.) 0.0855 X
insider the following sample of observations on coating thickness for low-viscosity paint. 0.83 1.42 0.88 0.88 1.04 1.09 1.17 1.29 1.31 1.49 1.59 1.62 1.65 1.71 1.76 1.83 USE SALT Assume that the distribution of coating thickness is normal (a normal probability plot strongly supports this assumption). (a) Calculate a point estimate of the mean value of coating thickness. (Round your answer to four decimal places.) 1.3475 ✓ State which estimator you used. O p Os Os/x x Ox (b) Calculate a point estimate of the median of the coating thickness distribution. (Round your answer to four decimal places.) 1.365 State which estimator you used and which estimator you might have used instead. (Select all that apply.) Os X Ор Os/x ✔x (c) Calculate a point estimate of the value that separates the largest 10% of all values in the thickness distribution from the remaining 90%. [Hint: Express what you are trying to estimate in terms of u and o.] (Round your answer to four decimal places.) 0.9096 X Ox State which estimator you used. O x O10th percentile O90th percentile (d) Estimate P(X < 1.5), i.e., the proportion of all thickness values less than 1.5. [Hint: If you knew the values of μ and o, you could calculate this probability. These values are not available, but they can be estimated.] (Round your answer to four decimal places.) 0.4286 x (e) What is the estimated standard error of the estimator that you used in part (b)? (Round your answer to four decimal places.) 0.0855 X

MATLAB: An Introduction with Applications
6th Edition
ISBN:9781119256830
Author:Amos Gilat
Publisher:Amos Gilat
Chapter1: Starting With Matlab
Section: Chapter Questions
Problem 1P

Related questions
Question
Please answer all parts because it’s one question. The first person got it wrong.
![Consider the following sample of observations on coating thickness for low-viscosity paint.
0.83 0.88
1.42
0.88 1.04 1.09
1.49 1.59 1.62
1.17 1.29 1.31
1.65 1.71 1.76 1.83
USE SALT
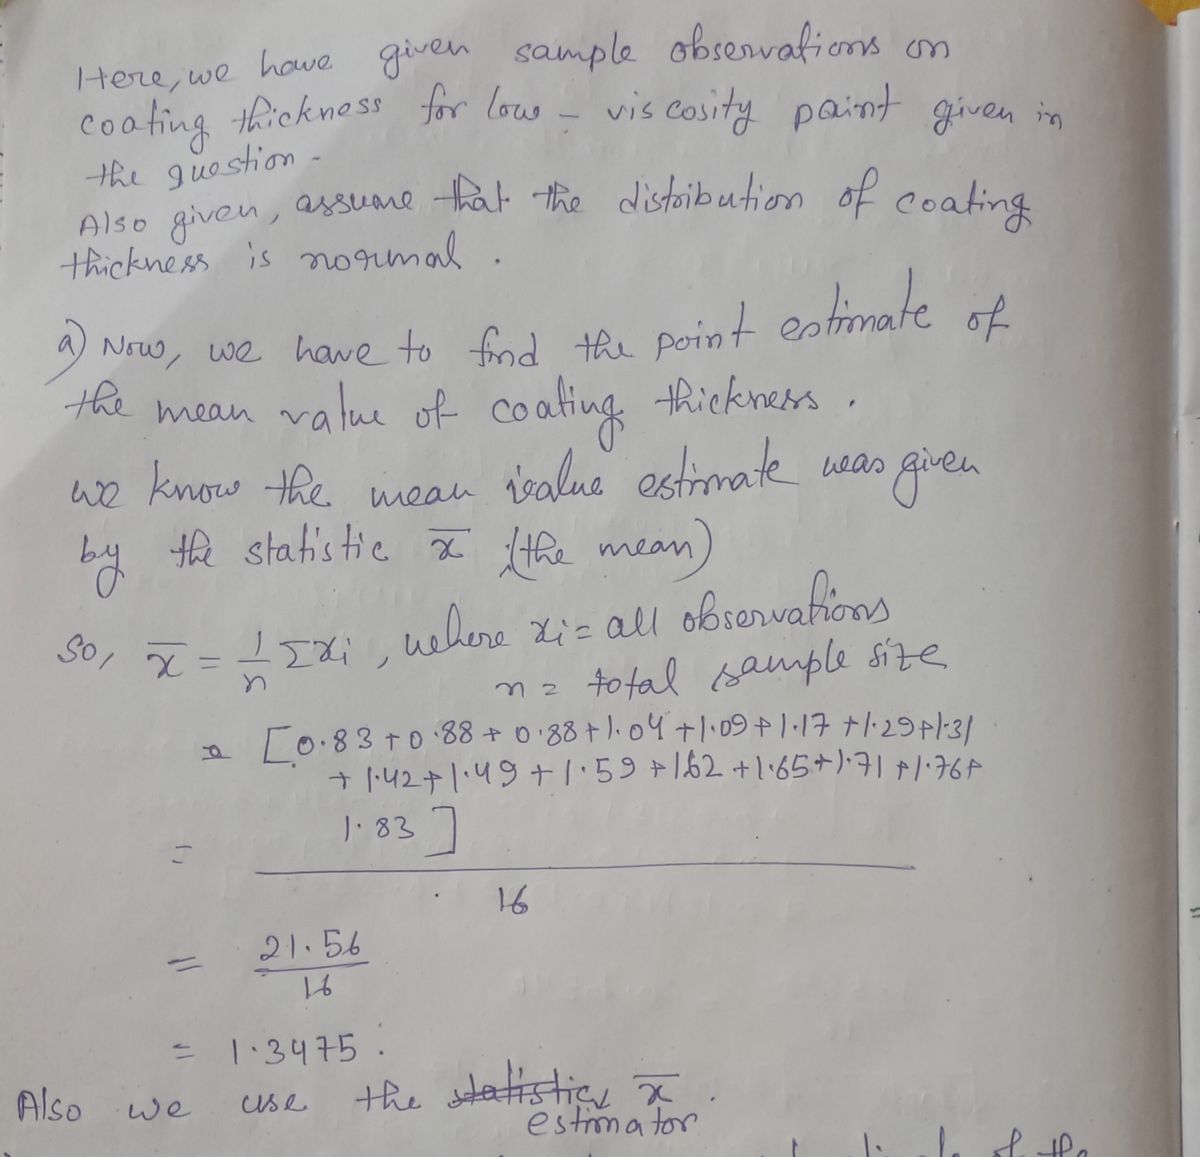
Assume that the distribution of coating thickness is normal (a normal probability plot strongly supports this assumption).
(a) Calculate a point estimate of the mean value of coating thickness. (Round your answer to four decimal places.)
1.3475
State which estimator you used.
Ор
Os
s/xX
O x
O x
(b) Calculate a point estimate of the median of the coating thickness distribution. (Round your answer to four decimal
places.)
1.365
State which estimator you used and which estimator you might have used instead. (Select all that apply.)
Os
✓X
Ор
Os/x
✓X
(c) Calculate a point estimate of the value that separates the largest 10% of all values in the thickness distribution from
the remaining 90%. [Hint: Express what you are trying to estimate in terms of u and o.] (Round your answer to four
decimal places.)
0.9096 x
State which estimator you used.
Ox
O 10th percentile
90th percentile
Os
S
Ox
(d) Estimate P(X < 1.5), i.e., the proportion of all thickness values less than 1.5. [Hint: If you knew the values of μ and o,
you could calculate this probability. These values are not available, but they can be estimated.] (Round your answer to
four decimal places.)
0.4286 X
(e) What is the estimated standard error of the estimator that you used in part (b)? (Round your answer to four decimal
places.)
0.0855
x
You may need to use the appropriate table in the Appendix of Tables to answer this question.](/v2/_next/image?url=https%3A%2F%2Fcontent.bartleby.com%2Fqna-images%2Fquestion%2F3dc90927-a4d4-417e-bb21-8f8d729f068b%2F894f0b2c-0147-4ccd-a796-6b0df9bdace9%2Fxvfzopo_processed.jpeg&w=3840&q=75)
Transcribed Image Text:Consider the following sample of observations on coating thickness for low-viscosity paint.
0.83 0.88
1.42
0.88 1.04 1.09
1.49 1.59 1.62
1.17 1.29 1.31
1.65 1.71 1.76 1.83
USE SALT
Assume that the distribution of coating thickness is normal (a normal probability plot strongly supports this assumption).
(a) Calculate a point estimate of the mean value of coating thickness. (Round your answer to four decimal places.)
1.3475
State which estimator you used.
Ор
Os
s/xX
O x
O x
(b) Calculate a point estimate of the median of the coating thickness distribution. (Round your answer to four decimal
places.)
1.365
State which estimator you used and which estimator you might have used instead. (Select all that apply.)
Os
✓X
Ор
Os/x
✓X
(c) Calculate a point estimate of the value that separates the largest 10% of all values in the thickness distribution from
the remaining 90%. [Hint: Express what you are trying to estimate in terms of u and o.] (Round your answer to four
decimal places.)
0.9096 x
State which estimator you used.
Ox
O 10th percentile
90th percentile
Os
S
Ox
(d) Estimate P(X < 1.5), i.e., the proportion of all thickness values less than 1.5. [Hint: If you knew the values of μ and o,
you could calculate this probability. These values are not available, but they can be estimated.] (Round your answer to
four decimal places.)
0.4286 X
(e) What is the estimated standard error of the estimator that you used in part (b)? (Round your answer to four decimal
places.)
0.0855
x
You may need to use the appropriate table in the Appendix of Tables to answer this question.
Expert Solution
Step 1

Trending now
This is a popular solution!

Step by step
Solved in 5 steps with 5 images

Recommended textbooks for you
MATLAB: An Introduction with Applications
Statistics
ISBN:
9781119256830
Author:
Amos Gilat
Publisher:
John Wiley & Sons Inc

Probability and Statistics for Engineering and th…
Statistics
ISBN:
9781305251809
Author:
Jay L. Devore
Publisher:
Cengage Learning

Statistics for The Behavioral Sciences (MindTap C…
Statistics
ISBN:
9781305504912
Author:
Frederick J Gravetter, Larry B. Wallnau
Publisher:
Cengage Learning
MATLAB: An Introduction with Applications
Statistics
ISBN:
9781119256830
Author:
Amos Gilat
Publisher:
John Wiley & Sons Inc
Probability and Statistics for Engineering and th…
Statistics
ISBN:
9781305251809
Author:
Jay L. Devore
Publisher:
Cengage Learning
Statistics for The Behavioral Sciences (MindTap C…
Statistics
ISBN:
9781305504912
Author:
Frederick J Gravetter, Larry B. Wallnau
Publisher:
Cengage Learning

Elementary Statistics: Picturing the World (7th E…
Statistics
ISBN:
9780134683416
Author:
Ron Larson, Betsy Farber
Publisher:
PEARSON

The Basic Practice of Statistics
Statistics
ISBN:
9781319042578
Author:
David S. Moore, William I. Notz, Michael A. Fligner
Publisher:
W. H. Freeman

Introduction to the Practice of Statistics
Statistics
ISBN:
9781319013387
Author:
David S. Moore, George P. McCabe, Bruce A. Craig
Publisher:
W. H. Freeman