Infusion: An IV line provides a continuous flow of a drug directly into the bloodstream. Assuming A no initial drug presence, the amount of the drug aftert hours is given by m(t) = ÷ (1 – e-kt) for t > 0, where A is the rate the drug flows in milligrams per hour. We say the steady state level is the amount of drug remaining after a long time has passed. k 1. Suppose an antibiotic with a half-life of 12 hours is given intravenously with A = 50 . Find the rate constant k and graph m(t) for 0

Advanced Engineering Mathematics
10th Edition
ISBN:9780470458365
Author:Erwin Kreyszig
Publisher:Erwin Kreyszig
Chapter2: Second-order Linear Odes
Section: Chapter Questions
Problem 1RQ
icon
Related questions
Question

4. m(t) = 400e^-0.462t

Infusion: An IV line provides a continuous flow of a drug directly into the bloodstream. Assuming
A
no initial drug presence, the amount of the drug aftert hours is given by m(t) = ÷ (1 – e-kt) for
t > 0, where A is the rate the drug flows in milligrams per hour. We say the steady state level is
the amount of drug remaining after a long time has passed.
k
1. Suppose an antibiotic with a half-life of 12 hours is given intravenously with A = 50 . Find
the rate constant k and graph m(t) for 0 <t< 48. Hint: you can find k as above, so maybe
use the formula that you derived earlier in question 4.
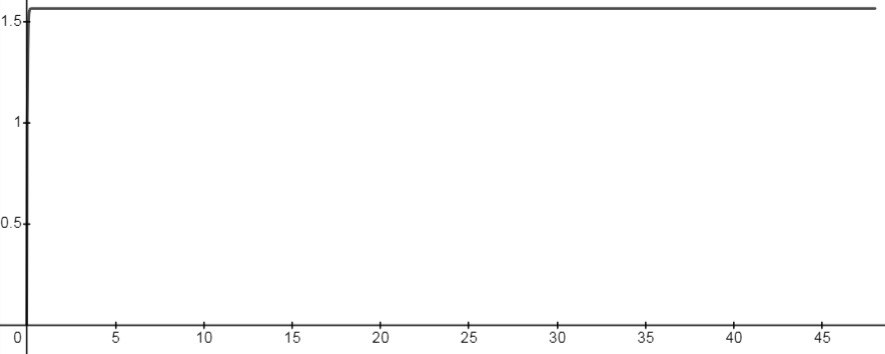
2. Using the plot from question 1, explain why the graph for infusion looks so different from the
graph for injection.
Transcribed Image Text:Infusion: An IV line provides a continuous flow of a drug directly into the bloodstream. Assuming A no initial drug presence, the amount of the drug aftert hours is given by m(t) = ÷ (1 – e-kt) for t > 0, where A is the rate the drug flows in milligrams per hour. We say the steady state level is the amount of drug remaining after a long time has passed. k 1. Suppose an antibiotic with a half-life of 12 hours is given intravenously with A = 50 . Find the rate constant k and graph m(t) for 0 <t< 48. Hint: you can find k as above, so maybe use the formula that you derived earlier in question 4. 2. Using the plot from question 1, explain why the graph for infusion looks so different from the graph for injection.
Expert Solution
Solution:

From question 4, we have m(t)=400e-0.462t.

Here, the amount of drug after t hours is m(t)=Ak1-e-kt.

The half life is 12 hours and A=50 mghr

So, m(12)=400e-0.462121.564

Use this amount and obtain the value of k:

1.564=50k1-e-12k

The value of k is 31.969.

Thus, we have

The amount of drug after t hours is m(t)=5031.9691-e-31.969t.

The graph of  is obtained as shown below:

Advanced Math homework question answer, step 2, image 1

steps

Step by step

Solved in 3 steps with 1 images

Blurred answer
Knowledge Booster
Cylinders and Cones
Learn more about
Need a deep-dive on the concept behind this application? Look no further. Learn more about this topic, advanced-math and related others by exploring similar questions and additional content below.
Recommended textbooks for you
Advanced Engineering Mathematics
Advanced Math
ISBN:
9780470458365
Author:
Erwin Kreyszig
Publisher:
Wiley, John & Sons, Incorporated
Numerical Methods for Engineers
Advanced Math
ISBN:
9780073397924
Author:
Steven C. Chapra Dr., Raymond P. Canale
Publisher:
McGraw-Hill Education
Introductory Mathematics for Engineering Applicat…
Advanced Math
ISBN:
9781118141809
Author:
Nathan Klingbeil
Publisher:
WILEY
Mathematics For Machine Technology
Advanced Math
ISBN:
9781337798310
Author:
Peterson, John.
Publisher:
Cengage Learning,
Basic Technical Mathematics
Advanced Math
ISBN:
9780134437705
Author:
Washington
Publisher:
PEARSON
Topology
Topology
Advanced Math
ISBN:
9780134689517
Author:
Munkres, James R.
Publisher:
Pearson,