In a study of speed dating, male subjects were asked to rate the attractiveness of their female dates, and a sample of the results is listed below (1=not attractive; 10=extremely attractive). Construct a confidence interval using a 99%confidence level. What do the results tell about the mean attractiveness ratings of the population of all adult females? 5,8,3,8,5,5,6,7,9,8,6,9 What is the confidence interval for the population mean μ?
In a study of speed dating, male subjects were asked to rate the attractiveness of their female dates, and a sample of the results is listed below (1=not attractive; 10=extremely attractive). Construct a confidence interval using a 99%confidence level. What do the results tell about the mean attractiveness ratings of the population of all adult females? 5,8,3,8,5,5,6,7,9,8,6,9 What is the confidence interval for the population mean μ?

MATLAB: An Introduction with Applications
6th Edition
ISBN:9781119256830
Author:Amos Gilat
Publisher:Amos Gilat
Chapter1: Starting With Matlab
Section: Chapter Questions
Problem 1P

Related questions

Question
In a study of speed dating, male subjects were asked to rate the attractiveness of their female dates, and a sample of the results is listed below (1=not attractive; 10=extremely attractive). Construct a confidence interval using a 99%confidence level. What do the results tell about the mean attractiveness ratings of the population of all adult females?
5,8,3,8,5,5,6,7,9,8,6,9
What is the confidence interval for the population mean μ?
Expert Solution
Step 1
Obtain the 99% confidence interval for the population mean μ.
The 99% confidence interval for the population mean μ is obtained below as follows:
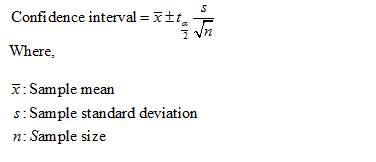
The formula for the Confidence interval for mean is:
Use EXCEL Procedure to obtain values for the given samples.
Follow the instruction to obtain the value of mean and SD:
- Open EXCEL
- Go to Data>Data Analysis.
- Choose Descriptive Statistics.
- Enter the input range as $A$1:$A$13.
- Check the Labels in the first row.
- Check the option Summary statistics
- Click OK.
EXCEL output:
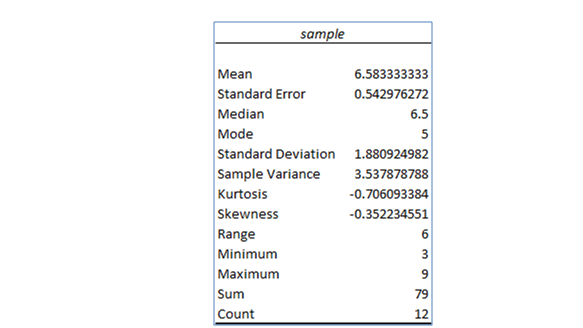
From the EXCEL output, the value of mean is 6.5833 and the standard deviation is 1.8809

Step by step
Solved in 2 steps with 4 images

Knowledge Booster


Learn more about
Need a deep-dive on the concept behind this application? Look no further. Learn more about this topic, statistics and related others by exploring similar questions and additional content below.Recommended textbooks for you
MATLAB: An Introduction with Applications
Statistics
ISBN:
9781119256830
Author:
Amos Gilat
Publisher:
John Wiley & Sons Inc

Probability and Statistics for Engineering and th…
Statistics
ISBN:
9781305251809
Author:
Jay L. Devore
Publisher:
Cengage Learning

Statistics for The Behavioral Sciences (MindTap C…
Statistics
ISBN:
9781305504912
Author:
Frederick J Gravetter, Larry B. Wallnau
Publisher:
Cengage Learning
MATLAB: An Introduction with Applications
Statistics
ISBN:
9781119256830
Author:
Amos Gilat
Publisher:
John Wiley & Sons Inc
Probability and Statistics for Engineering and th…
Statistics
ISBN:
9781305251809
Author:
Jay L. Devore
Publisher:
Cengage Learning
Statistics for The Behavioral Sciences (MindTap C…
Statistics
ISBN:
9781305504912
Author:
Frederick J Gravetter, Larry B. Wallnau
Publisher:
Cengage Learning

Elementary Statistics: Picturing the World (7th E…
Statistics
ISBN:
9780134683416
Author:
Ron Larson, Betsy Farber
Publisher:
PEARSON

The Basic Practice of Statistics
Statistics
ISBN:
9781319042578
Author:
David S. Moore, William I. Notz, Michael A. Fligner
Publisher:
W. H. Freeman

Introduction to the Practice of Statistics
Statistics
ISBN:
9781319013387
Author:
David S. Moore, George P. McCabe, Bruce A. Craig
Publisher:
W. H. Freeman