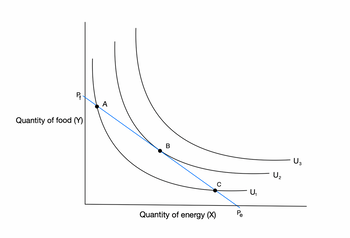
In a graph, plot an indifference curve and explain how you derive the optimal level of consumption of food and energy using the budget constraint. In 2022/2023, the UK government introduced the Energy Bill Support Scheme, which gave every household a discount on their energy bills for winter in the form of an income subsidy. Replicating the graph above, indicate how the indifference curve changes in the presence of the subsidy. How much of the change in the demand of each good is due to an income effect and how much to a substitution effect? Now suppose the subsidy is removed, and we return to the initial indifference curve (point a.). Imagine then that energy prices decrease by 10%, while food prices remain constant. How does the equilibrium presented graphically in part (a.) changes? As before, indicate how much of the change in quantity of each good consumed is due to the income effect and how much the substitution effect. Now, imagine that instead of the subsidy the UK government had responded to the cost-of-living crisis by subsidising both energy and food demand through a subsidy to producers resulting in a reduction of both energy prices and food prices by 10%. Using the same indifference curve of point a., what is the optimal level of consumption of energy following such intervention? How much of the change in quantity of each good consumed is due to an income effect and how much to a substitution effect?
Imagine a market that sells two goods: food, and energy, selling at
- In a graph, plot an indifference curve and explain how you derive the optimal level of consumption of food and energy using the budget constraint.
- In 2022/2023, the UK government introduced the Energy Bill Support Scheme, which gave every household a discount on their energy bills for winter in the form of an income subsidy. Replicating the graph above, indicate how the indifference curve changes in the presence of the subsidy. How much of the change in the demand of each good is due to an income effect and how much to a substitution effect?
- Now suppose the subsidy is removed, and we return to the initial indifference curve (point a.). Imagine then that energy prices decrease by 10%, while food prices remain constant. How does the equilibrium presented graphically in part (a.) changes? As before, indicate how much of the change in quantity of each good consumed is due to the income effect and how much the substitution effect.
- Now, imagine that instead of the subsidy the UK government had responded to the cost-of-living crisis by subsidising both energy and food demand through a subsidy to producers resulting in a reduction of both energy prices and food prices by 10%. Using the same indifference curve of point a., what is the optimal level of consumption of energy following such intervention? How much of the change in quantity of each good consumed is due to an income effect and how much to a substitution effect?
Trending now
This is a popular solution!
Step by step
Solved in 3 steps with 1 images

- I don't understand the difference of the impact on the indifference curve for when there is a subsidy on energy
price vs when there is a decrease in energy prices. what is the difference in change of both of these from an original indifference curve where there is no change in price or no subsidy implemented. - i have also done energy on x axis and food on the y axis so could you draw me to separate graphs of first the impact of an energy subsidy and then a second one with the impact of energy prices decreasing once the subsidy is removed.
Now, imagine that instead of the subsidy the UK government had responded to the cost-of-living crisis by subsidising both energy and food demand through a subsidy to producers resulting in a reduction of both energy
- please could you answer this showing a diagram of the indifference curve movement. could you do food on the y axis and energy on the x axis.

can you show the graph changes for the inclusions and removals of the subsidy and any labelling


