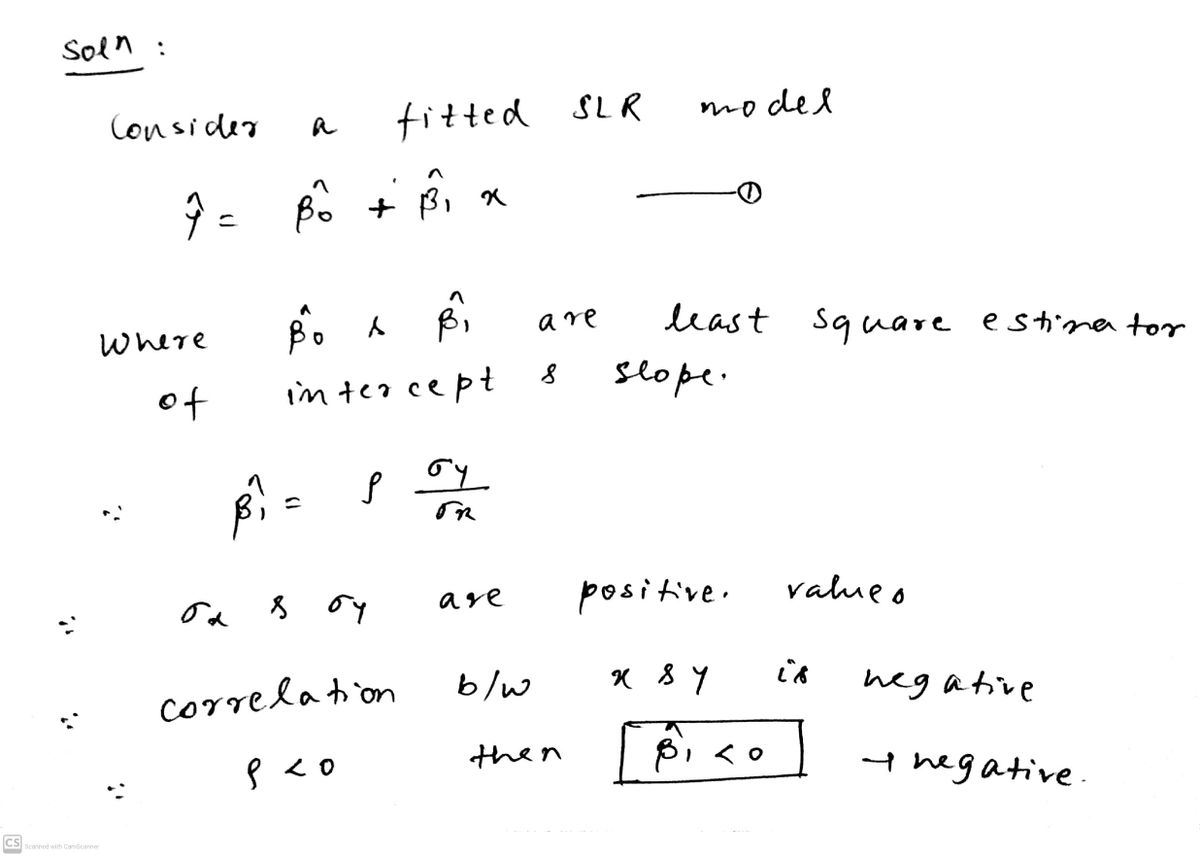
Il the iinear correlation between two vaiables Is negative, what can be sald about the slope of the regression Tine? ..... Choose the correct answer below. O A. More information is needed B. Negative O C. Positive
Q: determine whether the statement is true or false. If the statement is false, rewrite it as a true…
A: Least-squares regression line : A curve whose main aim is to lower the sum of squares of distances…
Q: . There is a calculator included in the toolbar but you might want to have one handy if you are not…
A: The objective of the question is to determine the proportion of variation in the dependent variable…
Q: 6.2 2) The program used to create this scatterplot found the line-of-best-fit and reported the…
A: Given : There are 2 variables arm span and height for several individuals r-squared value = 0.805
Q: In some population the interquartile range of the values of income (x) represents 41,9% of its…
A: Formula Used: Median = L+n2-CFf×h Quartile deviation Q = Q3-Q12 First quartile Q1 = L + n4-CFf×h…
Q: Based on the regression output, if you were to test the hypothesis that the coefficient on the…
A: Test is that whether the coefficient on the Payroll variable was equal to 0 or not.
Q: Before conducting inference for regression slope we need to check several assumptions be looking tat…
A:
Q: 0.10 v_i 0.20 0.30 0.00 0 50 80000 100 ශ්රසි Leverage values о 150 200
A: The provided chart of regression model analysis:The reason for using this type of plot in analyzing…
Q: Hi, I have a question on Simple Linear Regression and Correlation.
A: 3.The correlation coefficient is,
Q: 27. Below is some of the regression output from a regression of the price of a copier (expressed in…
A: From the regression output it can be determined that the intercept value of the regression equation…
Q: 9. If we omit a variable from a regression that is negatively correlated with the included…
A: If a variable that is negatively correlated with the included variables is omitted from a…
Q: With reference to the following data, find the correlation coefficient and the regression equation…
A: Given: Data x 91 87 75 66 50 34 y 58 63 68 71 79 80 To find: Correlation coefficient and…
Q: What is the name for the graph of matched xy data which is typically viewed before determining if…
A: Plot are graphical representations of numerical data
Q: Source df MS Number of obs 4,118 F(3, 4114) 547.19 Model 43529.8448 14509.9483 Prob > F 0.0000…
A: Consider the provided data that shows regression analysis of hourly earning wage depends on the…
Q: x = GPA y = SAT score In a test of linear correlation produces a P-value of 0.0204. At the…
A: x = GPA y = SAT score In a test of linear correlation produces a P-value of 0.0204
Q: Step 2 of 6: Find the estimated y-intercept. Round your answer to three decimal places. Answer How…
A: It is given that the two random variables the hours studying (X) and midterm grades (Y).
Q: True or false: ? a. If a line does not go through the point (x = average(x), y = average(y)), it…
A: Regression equation : It is the line made such type that the average distance of each point from…
Q: Run a regression analysis on the following bivariate set of data with y as the response variable. X…
A: Let x be an explanatory variable and y be a response variable. The data provided for x and y are as…
Q: Data from the United Nations on individual countries Obesity rates and vegetable consumption by…
A: From the above graph and regression line Linear Regression Equation for this data: y = -0.8449x +…
Q: 18. You are given below the following information about advertising and sales. Adv. Exp. (X) (Rs.…
A:
Q: The table below gives the number of hours five randomly selected students spent studying and their…
A: First we find the regression line for the above data set,
Q: Is it true to say that the linear correlation coefficient is 0.6839? this is true or false?
A: Here given scatter plot of data with Linear regression line. Equation of line : y = 740x + 435000…
Q: Pv. Don't provide handwriting solution
A: In a regression model examining depression, attachment anxiety significantly predicted higher levels…
Q: For the following data:- X Y 3 2 5 6 4 9 2 3 5 6 5 4 Find the regression equation…
A: Given that Input Data :Data set x = 3, 5, 4, 2, 5, 5Data set y = 2, 6, 9, 3, 6, 4Total number of…
Q: Step 1 of 6: Find the estimated slope. Round your answer to three decimal places. Answer How to…
A: Given information: Hours Studying x Midterm Grades y 1 60 2 65 4 76 5 82 6 86
Q: TIL TI Observation Yi Observation Yi 1 1 3 6 4 2 4 7 5 3 3 3 5 8 6 4 4 3 6 5 5 4 3 a. Develop an…
A: Use the Excel And Perform the Regression. Followings are the Steps to perform the Regression 1) Open…
Q: A. An article in the Journal of Sound and Vibration describeda study investigating the relationship…
A: Given, Noise Pressure Blood Pressure 2 65 2 63 3 65 2 71 4 75 1 81 3 80 5 96 1…
Q: A football coach is looking for a way to identify players that are "under weight". The coach decides…
A: Answer is 155 pounds
Q: If o, = 0, - = o and the angle between the regression lines is tar . Find the coefficient of…
A:
Q: (T/F) in multiple linear regression, if we reject the null hypothesis in the significance test, that…
A: A procedure leading to a decision about a particular hypothesis is called a test of a hypothesis.…
Q: If the correlation between X and Y is -.53, the regression will be____________________. a flat…
A: Given that If the correlation between X and Y is -.53 Note: According to bartleby experts question…
Q: Consider the following: 1. Test for significance of the coefficient of determination 2. F-test for…
A: For give conclusions based on simple linear regression: the correct option is e) 2 and 4
Q: ? = (X-uo)/ SE. %3D This formula allows us to compute the descriptive Z-score correlation…
A: Usually (X)-μSE is the standardization of sample mean or sometimes called z-score, which makes mean…
Q: Based on the tables and graphs below, interpret and report the results. You need to identify the…
A: There are 2 variables. ‘Value of monthly sales in $k in 2007’ is dependent variable (Y) and…
Q: The average exam score is 63 with a variance of 33. Your exam has a Z score of 0.96. What is your…
A:
Q: For ease of performing the next task, move the variable "Social Networks - Facebook, Twitter, etc"…
A: From the given information, Socail Network funding Billboard Careerbuilder Company Intranet…
Q: the researcher wishes to use numerical descriptive measures to summarize the data on each of the two…
A: a) The following procedure is used to find the mean, median, range, variance, standard deviation,…
Q: None
A: Option a: Coefficient of Determination is the degree of variations in the dependent variable…
Q: Which of the following does NOT indicate a clear violation of the assumptions for linear regression…
A: In linear regression is the linear method to model the relation between dependent variable and one…
Q: There is no linear relationship between two interval-ratio variables when the regression line on a…
A: Solution: If the regression line on the plot is parallel to x-axis, then it can say that there is no…
Q: 7) The following chart shows the distance from New City and the median housing prices in those…
A: Given: Distance from New City (x) Median home price (y) 12 390 15 400 28 310 20 290 5…
Q: Question 5. Figure 1 shows the correlation between four variables in a data set containing 88…
A: Given that the Figure 1 shows the correlation between four variables in a data set containing 88…
Q: Please rearrange the following steps of Multiple Linear Regression so that they are in order from…
A: The steps for multiple linear regression in the image can be reordered as follows:1. Create…
Q: What is the slope of the regression line ? What is the y-intercept of the regression line?…
A:
Q: More cholesterol Look again at Exercise 18’s regressionoutput for age and cholesterol level.a) The…
A: S=46.16a) For a given age , cholestrol levels will vary with a SD of 46.16 based on our model…
Step by step
Solved in 2 steps with 1 images
- can someone produce SPSS results by including the the intercept (a.k.a. the constant), standard error of estimate, unstandardized regression coefficient, the p-value for the unstandardized coefficient, R-square, Beta (i.e. standardized regression coefficient) using Excel with this given data? Overall: 3.4, 2.9, 2.6, 3.8, 3.0, 2.5, 3.9, 4.3, 3.8, 3.4, 2.8, 2.9, 4.1, 2.7, 3.9, 4.1, 4.2, 3.1, 4.1, 3.6, 4.3, 4.0, 2.1, 3.8, 2.7, 4.4, 3.1, 3.6, 3.9, 2.9, 3.7, 2.8, 3.3, 3.7, 4.2, 2.9, 3.9, 3.5, 3.8, 4.0, 3.1, 4.2, 2.9, 3.9, 3.5, 3.8, 4.0, 3.1, 4.2, 3.0, 4.8, 3.0, 4.4, 4.4, 3.4, 4.0, 3.5 Teach: 3.8, 2.8, 2.2, 3.5, 3.2, 2.7, 4.1, 4.2, 3.7, 3.7, 3.3, 3.3, 4.1, 3.1, 2.9, 4.5, 4.3, 3.7, 4.2, 4.0, 3.7, 4.0 2.9, 4.0, 3.3, 4.4, 3.4, 3.8, 3.7, 3.1, 3.8, 3.2, 3.5, 3.8, 4.4, 3.7, 4.00, 3.4, 3.2, 3.8, 3.7, 4.3, 3.4, 4.0 3.1, 4.5, 4.8, 3.4, 4.2, 3.4 Exam: 3.8 3.2, 1.9, 3.5, 2.8, 3.8, 3.8, 4.1, 3.6, 3.6, 3.5, 3.3, 3.6, 3.8, 3.8, 4.2, 4.1, 4.0, 4.3, 4.2, 4.0, 4.1, 2.7, 4.4, 4.4, 4.3, 3.6, 4.1, 4.2, 3.6,…A researcher collected data on people's heights and their shoe sizes from 500 people (N=500). Then, she convert the two variables (X-: heig ht, Y: shoe size) to standard scores before computing regression constants and the correlation coefficient between the two variables. The correlation coefficient (from the standardized scores) was found to be r = .37. Which of the following statements is CORRECT? a. Although the correlation coefficient is positive (r=.37), the regression slope can be negative O b. If the correlation coefficient was computed from raw scores, it will not be r=.37 O c. The regression slope (from the standardized scores) is the same as the correlation coefficient (r=.37) Od. The Y-intercept (from the standardized scores) is the same as the correlation coefficient (r=.37)state whether is true or false QUESTION 16The most commonly used measure of central tendency of a distribution of scores is the medianbecause it indicates the middle value.QUESTION 17In the simple linear regression model y D 0 C 1x C "; the error term values explain the variationin the y–values that could be observed when the independent variable is x:
- 7. Given No. of pairs = 12 %3D Y A M 74.50 125.50 Std. Deviation 13.07 15.85 Summation of products of corresponding deviations from respective means =2176. Calculate the co-efficient of correlation between X and Y and find the regressions equations. CS Scanned with CamScannerhos (Y 00 5. The following results were declared in Economics and Mathematics in B. Com examination. Scores in Economics (X) Scores in Mathematics (Y) Mean 40 30 Standard deviation 10 20 Karl Pearson's coefficient of correlation between X and Y = +0.4. Find both the regression lines. Using these regression lines, estimate the value of Y for X = 40 and estimate the value of X for Y = 20.please answer Alll
- A group of 13 health children and adolescents participated in a study designed to analyze the relationship between age (AGE in years) and average total sleep time (ATST in minutes). To obtain a measure for ATST, recordings were taken on each subject on three consecutive nights and then averaged. The results obtained are given below along with the corresponding scatter plot. The estimated regression line is Y-hat= 646.483 – 14.041x Interpret the slope and intercept of the estimated regression line. Is it meaningful?Help with the problem1. Greater than or less than? 2. Increase or decrease?
- Explain Which of the following statements are true about studentized residuals? They are the deviations of the observed values from the fitted line. They're closely related to the errors of prediction of the observation. Large studentized residuals will lead to large influence on the regression model in all circumstancesWhich of the following statements are not correct? O The coefficient of determination, denoted by r^2 is interpreted as the proportion of observed y variation that cannot be explained by the simple linear regression model. O The higher the value of the coefficient of determination, the more successful is the simple linear regression model in explaining y variation. If the coefficient of determination is small, an analyst will usually want to search for an alternative model (either a nonlinear model or a multiple regression model that involves more than a single independent variable). The coefficient of determination can assume any value between 0 and 1, inclusive.Please help asap I can’t get any more questions wrong