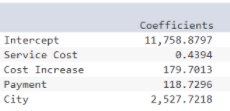
If there is a 30,000 average Service Cost in marketing services, with a 70% Cost Increase and 60% of client Payment for services upfront in addition to advantages of City, the predicted annual earnings for the firm are: Standard Coefficients Error t Stat p-value Intercept 11,758.8797 7,557.5802 1.556 0.123 Service Cost 0.4394 0.112 3.938 0.0001 Cost Increase 179.7013 69.7115 2.578 0.0113 Рayment City 118.7296 116.421 1.020 0.3100 2,527.7218 1,107.640 2.282 0.024
Contingency Table
A contingency table can be defined as the visual representation of the relationship between two or more categorical variables that can be evaluated and registered. It is a categorical version of the scatterplot, which is used to investigate the linear relationship between two variables. A contingency table is indeed a type of frequency distribution table that displays two variables at the same time.
Binomial Distribution
Binomial is an algebraic expression of the sum or the difference of two terms. Before knowing about binomial distribution, we must know about the binomial theorem.

Here the coefficients of independent variables are given in the Table.
He will write a multiple regression equation based on the Data that will be used to predict the required answer

Equation would be :
Y = 11758.8797 + 0.4394*x1 + 179.7013*x2 + 118.7296*x3
Trending now
This is a popular solution!
Step by step
Solved in 2 steps with 1 images


