If a student is chosen at random, what is the probability that they do not enjoy any of those activities? O 0.175 O 0.120 O 0.525 O 0.500


Contingency Table
A contingency table can be defined as the visual representation of the relationship between two or more categorical variables that can be evaluated and registered. It is a categorical version of the scatterplot, which is used to investigate the linear relationship between two variables. A contingency table is indeed a type of frequency distribution table that displays two variables at the same time.
Binomial Distribution
Binomial is an algebraic expression of the sum or the difference of two terms. Before knowing about binomial distribution, we must know about the binomial theorem.

The event W is defined as student enjoy watching movies, event R is defined as student enjoy running, event N is defined as student enjoy reading novels.
From the information given, the Venn diagram is,
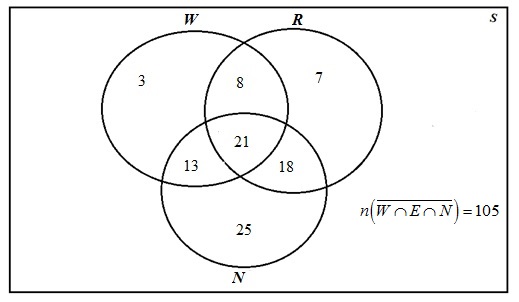
From the Venn diagram, the number of students do not enjoy any of those activities is 105.

Step by step
Solved in 2 steps with 1 images


