I. The data related to the number of cars sold in different dealers in the United States in a week (sample) are presented below. Round the final results to two decimal places when necessary. 175 123 212 320 179 191 141 226 191 314 324 192 135 195 216 232 299 171 Calculate: 1) Average 2) Fashion 3) Medium ド8

MATLAB: An Introduction with Applications
6th Edition
ISBN:9781119256830
Author:Amos Gilat
Publisher:Amos Gilat
Chapter1: Starting With Matlab
Section: Chapter Questions
Problem 1P
icon
Related questions
Topic Video
Question
I.
The data related to the number of cars sold in different dealers in the United States in a
week (sample) are presented below. Round the final results to two decimal places when
necessary.
175
123
212
320
179
191
141
226
191
314
324
192
135
195
216
232
299
171
Calculate:
1) Average
2) Fashion
3) Medium
ド8
Transcribed Image Text:I. The data related to the number of cars sold in different dealers in the United States in a week (sample) are presented below. Round the final results to two decimal places when necessary. 175 123 212 320 179 191 141 226 191 314 324 192 135 195 216 232 299 171 Calculate: 1) Average 2) Fashion 3) Medium ド8
Expert Solution
Step 1

Hello Dear, since your question has multiple sub-parts. As per our policy we can answer only first 3 sub-parts.

If you want solution for other sub-parts also, then make separate request.

We have given the data related to the number of cars sold in different dealers in the United States in a week (sample).


Step 2

1)

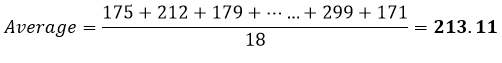
Average is the arithmetic mean of the data.

Statistics homework question answer, step 2, image 1

Statistics homework question answer, step 2, image 2

2)

Fashion / mode-

It is the most repeated value in the data set.

So, here most repeated value i.e. mode = 191.


3)

Median- It is the way to find exact middle of the data set, by ordering the data set in ascending order.

Or, we can use excel function.

I am solving here by excel using formula,

“=MEDIAN(175:171)”

In excel no need of arranging the data in ascending order, write the formula and select the data set.

So, median = 193.5

steps

Step by step

Solved in 3 steps with 2 images

Blurred answer
Knowledge Booster
Hypothesis Tests and Confidence Intervals for Means
Learn more about
Need a deep-dive on the concept behind this application? Look no further. Learn more about this topic, statistics and related others by exploring similar questions and additional content below.
Similar questions
Recommended textbooks for you
MATLAB: An Introduction with Applications
Statistics
ISBN:
9781119256830
Author:
Amos Gilat
Publisher:
John Wiley & Sons Inc
Probability and Statistics for Engineering and th…
Statistics
ISBN:
9781305251809
Author:
Jay L. Devore
Publisher:
Cengage Learning
Statistics for The Behavioral Sciences (MindTap C…
Statistics
ISBN:
9781305504912
Author:
Frederick J Gravetter, Larry B. Wallnau
Publisher:
Cengage Learning
Elementary Statistics: Picturing the World (7th E…
Statistics
ISBN:
9780134683416
Author:
Ron Larson, Betsy Farber
Publisher:
PEARSON
The Basic Practice of Statistics
Statistics
ISBN:
9781319042578
Author:
David S. Moore, William I. Notz, Michael A. Fligner
Publisher:
W. H. Freeman
Introduction to the Practice of Statistics
Statistics
ISBN:
9781319013387
Author:
David S. Moore, George P. McCabe, Bruce A. Craig
Publisher:
W. H. Freeman