The following graph represents the short-run aggregate supply curve (SRAS) based on an expected price level of 120. The economy's full- employment output level is $9 trillion. Major unions across the country have recently negotiated three-year wage contracts with employers. The wage contracts are based on an expected price level of 120, but the actual price level turns out to be 160. Show the short-run effect of the unexpectedly high price level by dragging the curve or moving the point to the appropriate position. PRICE LEVEL (CPI) 240 200 160 120 80 40 0 3 SRAS[120] 9 12 REAL GDP (Trillions of dollars) 15 18 SRAS[120] 0 (? Interpret the change you drew on the previous graph by filling in the blanks in the following paragraph: less/more The higher-than-expected price level causes firms to earn profit than they expected on each unit of output they produce, and, therefore, decrease/increaseir production level. At the same time, the real value of wages and other resource prices is lower/higher than workers and they firms expected when they signed long-term contracts. As a result, the economy as a whole produces at a level output, and the unemployment rate is than its natural rate. its full-employment above/below
The following graph represents the short-run aggregate supply curve (SRAS) based on an expected price level of 120. The economy's full- employment output level is $9 trillion. Major unions across the country have recently negotiated three-year wage contracts with employers. The wage contracts are based on an expected price level of 120, but the actual price level turns out to be 160. Show the short-run effect of the unexpectedly high price level by dragging the curve or moving the point to the appropriate position. PRICE LEVEL (CPI) 240 200 160 120 80 40 0 3 SRAS[120] 9 12 REAL GDP (Trillions of dollars) 15 18 SRAS[120] 0 (? Interpret the change you drew on the previous graph by filling in the blanks in the following paragraph: less/more The higher-than-expected price level causes firms to earn profit than they expected on each unit of output they produce, and, therefore, decrease/increaseir production level. At the same time, the real value of wages and other resource prices is lower/higher than workers and they firms expected when they signed long-term contracts. As a result, the economy as a whole produces at a level output, and the unemployment rate is than its natural rate. its full-employment above/below
Chapter1: Making Economics Decisions
Section: Chapter Questions
Problem 1QTC
Related questions
Question
Need help with this. Please show how to do the graphs. I showed with lines where you can move them to and of course while you read the paragraphs you will be able to know it. Thanks!

Transcribed Image Text:Now, suppose prices remain higher than expected. As a result, in the next round of labor negotiations, unions demand and obtain higher wages
for their members. The following graph shows the long-run aggregate supply curve (LRAS) at full-employment output for this economy as well
as the same initial short-run aggregate supply curve as in the first graph. Shift one or both of these lines to illustrate how the economy adjusts
to a new long-run equilibrium.
240
200
160
PRICE LEVEL (CPI)
심
40
0
3
↓
LRAS
71
SRAS
6
9
12
REAL GDP (Trillions of dollars)
15
18
LRAS
SRAS
![The following graph represents the short-run aggregate supply curve (SRAS) based on an expected price level of 120. The economy's full-
employment output level is $9 trillion.
Major unions across the country have recently negotiated three-year wage contracts with employers. The wage contracts are based on an
expected price level of 120, but the actual price level turns out to be 160. Show the short-run effect of the unexpectedly high price level by
dragging the curve or moving the point to the appropriate position.
PRICE LEVEL (CPI)
240
200
160
40
0
0
3
SRAS[120]
6
9
12
REAL GDP (Trillions of dollars)
15
18
lower/higher
SRAS[120]
☐
?
Interpret the change you drew on the previous graph by filling in the blanks in the following paragraph:
less/more
profit than they expected on each unit of output they produce, and, therefore,
lower/higher than workers and
its full-employment
The higher-than-expected price level causes firms to earn
they decrease/increaseir production level. At the same time, the real value of wages and other resource prices is
firms expected when they signed long-term contracts. As a result, economy as a whole produces at a level
output, and the unemployment rate is
than its natural rate.
above/below](/v2/_next/image?url=https%3A%2F%2Fcontent.bartleby.com%2Fqna-images%2Fquestion%2F263acbce-38fa-4709-98a2-4a62e1170ee8%2F2b02de70-69f7-4f4f-825f-b58779d21feb%2Fbnuto8t_processed.png&w=3840&q=75)
Transcribed Image Text:The following graph represents the short-run aggregate supply curve (SRAS) based on an expected price level of 120. The economy's full-
employment output level is $9 trillion.
Major unions across the country have recently negotiated three-year wage contracts with employers. The wage contracts are based on an
expected price level of 120, but the actual price level turns out to be 160. Show the short-run effect of the unexpectedly high price level by
dragging the curve or moving the point to the appropriate position.
PRICE LEVEL (CPI)
240
200
160
40
0
0
3
SRAS[120]
6
9
12
REAL GDP (Trillions of dollars)
15
18
lower/higher
SRAS[120]
☐
?
Interpret the change you drew on the previous graph by filling in the blanks in the following paragraph:
less/more
profit than they expected on each unit of output they produce, and, therefore,
lower/higher than workers and
its full-employment
The higher-than-expected price level causes firms to earn
they decrease/increaseir production level. At the same time, the real value of wages and other resource prices is
firms expected when they signed long-term contracts. As a result, economy as a whole produces at a level
output, and the unemployment rate is
than its natural rate.
above/below
Expert Solution
This question has been solved!
Explore an expertly crafted, step-by-step solution for a thorough understanding of key concepts.
This is a popular solution!
Trending now
This is a popular solution!
Step by step
Solved in 3 steps with 2 images

Follow-up Questions
Read through expert solutions to related follow-up questions below.
Follow-up Question
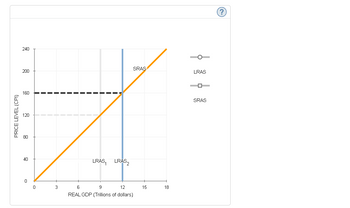
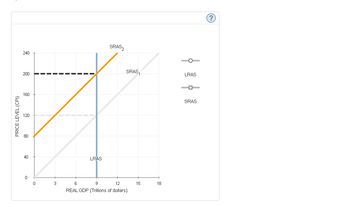
I have a question regarding the last graph that you did. I cannot shift the SRAS like you did. Check the two ScreenShots that I attached. Which one will be correct one ?

Transcribed Image Text:240
200
160
PRICE LEVEL (CPI)
8
40
0
3
LRAS, LRAS₂
SRAS
6
9
12
REAL GDP (Trillions of dollars)
15
18
LRAS
PR
SRAS

Transcribed Image Text:PRICE LEVEL (CPI)
240
200
160
120
80
40
0
0
3
LRAS
SRAS₂
SRAS,
6
9
12
REAL GDP (Trillions of dollars)
15
18
LRAS
SRAS
Solution
Knowledge Booster
Learn more about
Need a deep-dive on the concept behind this application? Look no further. Learn more about this topic, economics and related others by exploring similar questions and additional content below.Recommended textbooks for you


Principles of Economics (12th Edition)
Economics
ISBN:
9780134078779
Author:
Karl E. Case, Ray C. Fair, Sharon E. Oster
Publisher:
PEARSON

Engineering Economy (17th Edition)
Economics
ISBN:
9780134870069
Author:
William G. Sullivan, Elin M. Wicks, C. Patrick Koelling
Publisher:
PEARSON


Principles of Economics (12th Edition)
Economics
ISBN:
9780134078779
Author:
Karl E. Case, Ray C. Fair, Sharon E. Oster
Publisher:
PEARSON

Engineering Economy (17th Edition)
Economics
ISBN:
9780134870069
Author:
William G. Sullivan, Elin M. Wicks, C. Patrick Koelling
Publisher:
PEARSON

Principles of Economics (MindTap Course List)
Economics
ISBN:
9781305585126
Author:
N. Gregory Mankiw
Publisher:
Cengage Learning

Managerial Economics: A Problem Solving Approach
Economics
ISBN:
9781337106665
Author:
Luke M. Froeb, Brian T. McCann, Michael R. Ward, Mike Shor
Publisher:
Cengage Learning

Managerial Economics & Business Strategy (Mcgraw-…
Economics
ISBN:
9781259290619
Author:
Michael Baye, Jeff Prince
Publisher:
McGraw-Hill Education