I decided to check the temperature difference between my current city and where I spent most of my teen/twenties. I came to find out that Appleton, WI is mildly colder during this time of the year than New York City, NY. In the past 11 days it was recorder that in Appleton the highest temperature at noon from September 18th to 28th was: 57, 64, 66, 72, 77, 81, 72, 77, 75, 61 and 55 (in Fahrenheit).Compared to New York City, NY, where the weather registered at:70, 63, 64, 64, 72, 79. 75, 77, 73, 79 and 70 (in Fahrenheit). This data was collected from https://www.timeanddate.com/weather/usa/appleton/historic. Due to the fact the data is accurate, in this case the level of confidence is at 98%.
Inverse Normal Distribution
The method used for finding the corresponding z-critical value in a normal distribution using the known probability is said to be an inverse normal distribution. The inverse normal distribution is a continuous probability distribution with a family of two parameters.
Mean, Median, Mode
It is a descriptive summary of a data set. It can be defined by using some of the measures. The central tendencies do not provide information regarding individual data from the dataset. However, they give a summary of the data set. The central tendency or measure of central tendency is a central or typical value for a probability distribution.
Z-Scores
A z-score is a unit of measurement used in statistics to describe the position of a raw score in terms of its distance from the mean, measured with reference to standard deviation from the mean. Z-scores are useful in statistics because they allow comparison between two scores that belong to different normal distributions.
I decided to check the temperature difference between my current city and where I spent most of my teen/twenties. I came to find out that Appleton, WI is mildly colder during this time of the year than New York City, NY. In the past 11 days it was recorder that in Appleton the highest temperature at noon from September 18th to 28th was: 57, 64, 66, 72, 77, 81, 72, 77, 75, 61 and 55 (in Fahrenheit).Compared to New York City, NY, where the weather registered at:70, 63, 64, 64, 72, 79. 75, 77, 73, 79 and 70 (in Fahrenheit). This data was collected from https://www.timeanddate.com/weather/usa/appleton/historic. Due to the fact the data is accurate, in this case the level of confidence is at 98%.
Null and alternate hypotheses:
The investigator is specifically interested to test whether there is any temperature difference in the current city Appleton and New York city or not.
Denote µ1 as the population mean temperature in the city Appleton and µ2 as the population mean temperature in the city New York.
Null hypothesis:
H0 : μ1 = μ2
That is, there is no significant difference between the mean temperature between the current city Appleton and New York city.
Alternative hypothesis:
H1 : μ1 ≠ μ2
That is, there is a significant difference between the mean temperature between the current city Appleton and New York city.
In order to test the hypothesis regarding the significant difference between the means of two independent samples, when the population standard deviations are unknown an independent sample t-test is appropriate.
EXCEL software can be used to perform two sample t test.
Software Procedure:
Step-by-step software procedure to perform a two sample t test using EXCEL software is as follows:
- Open an EXCEL file.
- Enter the data of Appleton in column A and name it as Appleton.
- Enter the data of New York in column B and name them as New York.
- Go to Data > Data Analysis > t – Test: Two-sample assuming equal variances.
- Enter Variable 1 Range as $A$1:$A$12, enter Variable 2 Range as $B$1:$B$12.
- Select Labels, and enter the Alpha as 02.
- Click OK.
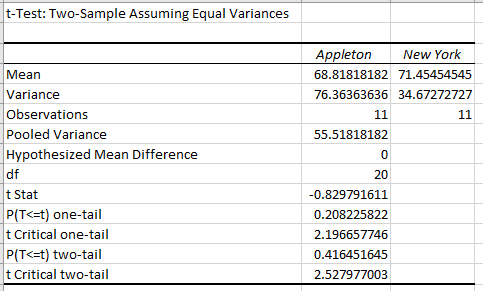
The output is shown below:

From the obtained output, the P-value corresponding to 2-tailed test is 0.4165.
Trending now
This is a popular solution!
Step by step
Solved in 2 steps with 1 images


