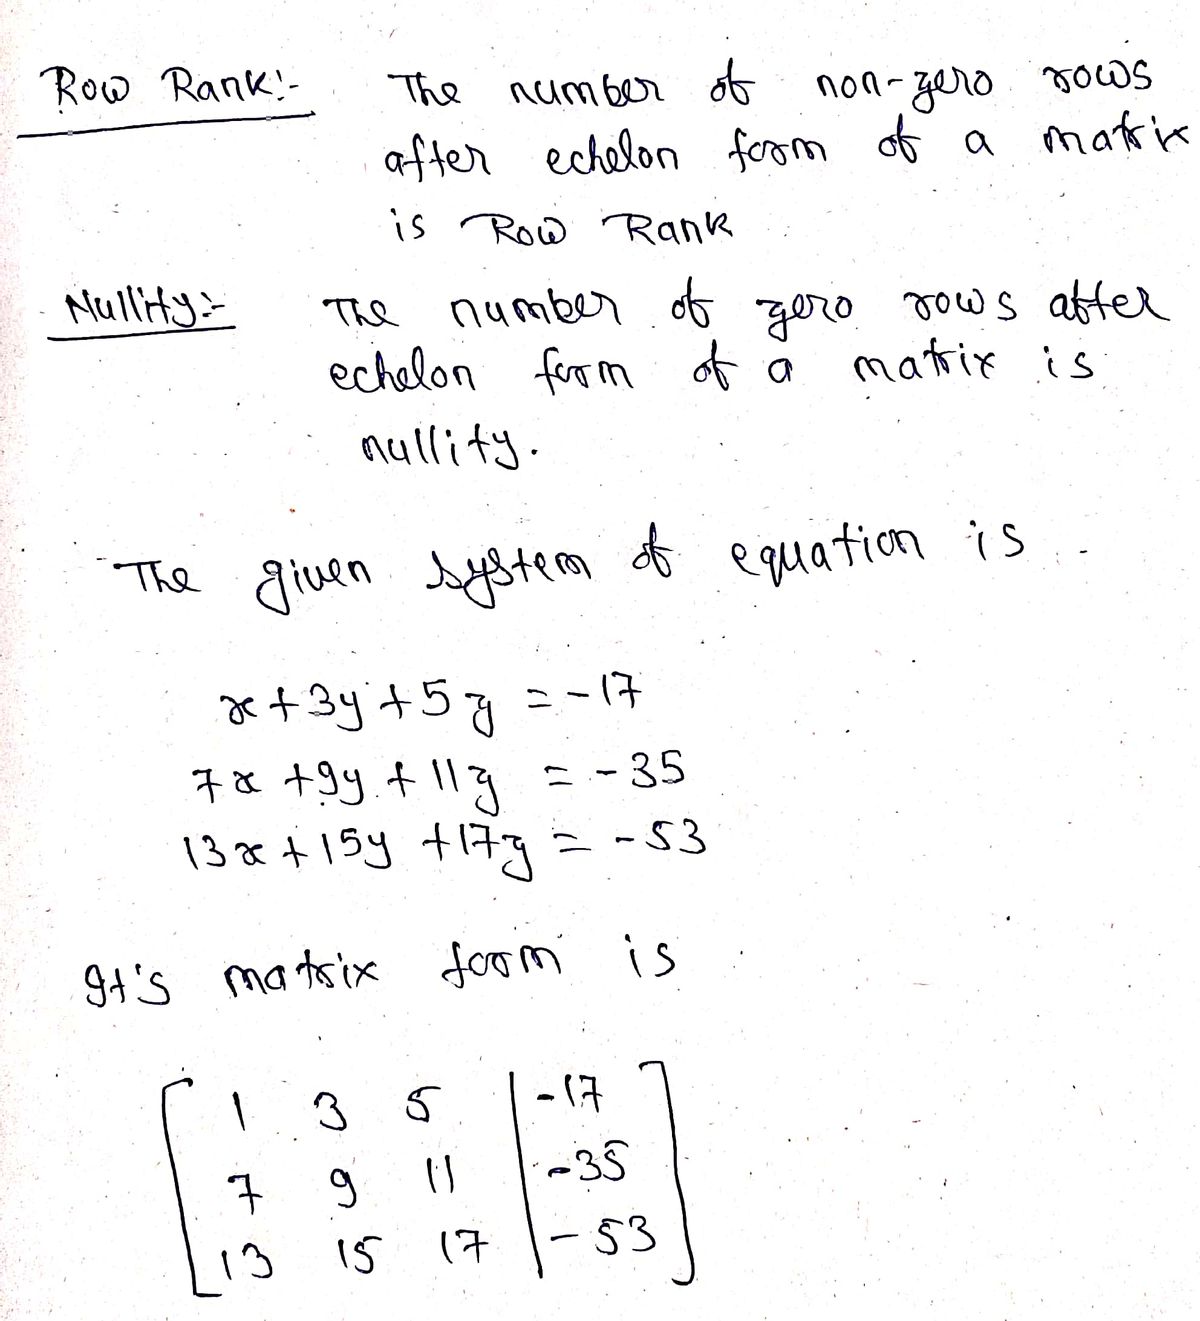
How to determine the row rank and nullity of the SPL as attached example?
Q: Researchers report that university students who are on Twitter or have it running in the background)…
A: Dependent and independent variable: The variable of interest, regarding which, the prediction is…
Q: Differentiate between Missing at Random (MAR) and Missing Completely Random (MCAR) missing data. at
A: Missing Data Mechanism A data point has some likelihood of being missing and these probabilities is…
Q: A research has been conducted to determine the factors affecting the tax return preparation period.…
A:
Q: There are 39 observations representing the 39 Peruvians in the dataset and 10 variables. Factor…
A: Given, There are 39 observation representing the 39 Peruvians in the data set and 10 variables.…
Q: (i) If a data set has nturning points where n∈W, and you wish to model the data with a polynomial,…
A: The given data set 0,0, 1,-3, 2,0, -1,3 We can make a scatter plot for this data and answer all the…
Q: What is the chi square-crit for the alpha level of .05 when you have 3 column categories and 3 row…
A:
Q: In Austria ,The amount of money spent on the restoration of a sanctuary and the distinct kangaroo…
A: Negative correlation between amount of money spent and kangaroo population means if amount of money…
Q: A researcher wants to examine the effect of humidity on amount of hair frizz. How could the…
A: 1. To examine the effect of humidity on the amount of hair frizz using a multiple-groups design, the…
Q: A scatter diagram is given with one of the points drawn in blue (large point) The line drawn in red…
A: The regression shows a relationship between two variables.
Q: Roger is conducting a corelation matrix .he creates a corelation matrix with five variables ,using…
A: While testing the hypothesis we use p-values, alpha, critical values and obtained values or…
Q: In a factorial experiment, Jessica studied the effects of vibration rates (Factor A) on seed…
A: Given that: SOV df SS MS F Block Factor A 4 29 Factor B 3 66 A X B 59…
Q: The article “Characterization of Highway Runoff in Austin, Texas, Area” (J. of Envir. Engr., 1998:…
A: Regression equation is used for prediction of data set. It has the two variables, they are…
Q: The datafile Gestation06 lists the average gestation period (in days) and longevity (in years) for a…
A: Introduction: The response variable is Gestation, and the predictor variable is Longevity.
Q: The following data is about the number of turns required to break a certain type of forged alloy…
A: Use EXCEL to determine the regression equation. EXCEL procedure: Go to EXCEL Go to Data>Data…
Q: Show that for 2² factorial experiment the main effects and interactions are mutually orthogonal.
A: Answer: For the given data,
Q: Suppose 5 out of 25 data points in a weighted least-squares problem have a y-measurement that is…
A: 5 out of 25 data points in a weighted least-squares problem have a y-measurement that is less…
Q: An agriculturalist on a farm conducted a study to investigate whether ladybugs are effective in…
A: Number of pairs of trees selected with a positive difference in number of damaged avocado fruit is…
Q: The structure of a two-factor study can be presented as a matrix with a level of one factor…
A: The structure of a two-factor study can be presented as a matrix with a level of one factor…
Q: d- Write down the least squares line by using the information obtained from above table. e-…
A: The regression shows a relationship between 1 dependent variable and 1 or more independent…
Q: Suppose we are collecting data for a study, and we have the data points (1, 4), (3, 5), (3, 3), and…
A: Given Data Points: (1, 4), (3, 5), (3, 3), and (5, 6).
Q: What is the chi square-crit for the alpha level of .05 when you have 5 column categories and 5 row…
A: Given : alpha level of 0.05 we have 5 column categories and 5 row categories (5x5 grid)
Q: Four different formulations of an industrial glue are being tested. Each of the different…
A: Testing strength of industrial glue based on its formulation and application thickness.
Q: ) Consider a model for firm profitability in a particular industry (say, automobile), w…
A: Since you have asked multiple question, we will solve the first question for you. If you want any…
Q: erated by large-scale combustion ("Fly Ash Binders Stabilization of FGD Wastes," J. of Environmental…
A: Solution
Q: What odds ratio does exp(?) represent in Model 1? What odds ratio does exp(?) represent in Model 2?…
A: Logistic regression
Q: A technique for processing jobs on a first-come, first-served basis is known as FIFO why?
A: FIFO
Q: Researchers report that university students who are on Twitter or have it running in the background)…
A: Since you have posted a question with multiple sub-parts, we will solve first three sub-parts for…
Q: A teacher is comparing the academic performance through the General Weighted Average of Senior High…
A: Here , The teacher is comparing the academic performance of Senior High School students in three…
Q: What does it mean if the assumptions of ordinary least squares estimator are not met? -Why is this a…
A: Ordinary least sqaures estimator The OLS estimator in regression is the way to predict the unknown…
Q: 10+ 20 30 40 50 60 Age (years) Interpret the residual for the man indicated in the scatter plot…
A:
Q: Disk drives once more Here are the residuals for aregression of Price on Capacity for the hard…
A: a. The residuals for a regression of price on capacity for the hard drives mentioned in Exercise 6…
Q: For below data points : a-) linear fit b-) 3rd order polynomial fit and
A: First of all, to choose the best fit, we should look at the scatter plot of data. One can get a…
Q: 14. Suppose you build a Partial Least Squares model where you prepared the data by centering and…
A: No, we cannot proceed to perform a 5-fold Cross Validation without performing additional data…
Q: Every Saturday, The Free Press, Mankato, Minnesota's daily newspaper, reports the number of new…
A: Hello! As you have posted more than 3 sub parts, we are answering the first 3 sub-parts. In case…
Q: The structure of a two-factor study can be presented as a matrix with the levels of one factor…
A: We are testing three null hypothesis: There is no difference in the means of factor A (H0:…
Q: Why it is suggested GLS (Generalized Least Squares ) method as most appropriate in panel data…
A:
Q: Consider an experiment using birds in which we create a lull factorial design to examine the effects…
A: In multiple linear regression, there will be more than one independent variable. In simple linear…
Q: A research has been conducted to determine the factors affecting the tax return preparation period.…
A: Note: Hi there! Thank you for posting the question. As your question has more than 3 parts, we have…
Q: In a study of fertilizers, researchers randomly selected 25 corn farms that use Brand A fertilizer…
A: The question describes a study where researchers have selected two groups of corn farms. Each farm…
Q: Percentages of public school students in fourth and eighth grades who were above the proficiency…
A: Use EXCEL to construct the scatter plot. EXCEL procedure: Go to EXCEL Go to Insert menu…
Q: A researcher conducted a 2-factor ANOVA on the data from his experiment and found a significant main…
A: In this case, it is obtained that there are significant main effects due to factor A and B.
How to determine the row rank and nullity of the SPL as attached example?
Step by step
Solved in 2 steps with 2 images
- In a regression problem with 2 input variables, we construct a classification tree with 4 terminal nodes. This means(multiple choices) There was either four splits in only one of the input variables or one split in each of the input variable. There was a split in one of the input variables and no splits in the other. There was a split in each input variable. There was either a split in each input variable or three splits in only one of the input variables. There were 2 splits in each of the input variables.The structure of a two-factor study can be presented as a matrix, with one factor determining the rows and the second factor determining the columns. With this structure in mind, identify the three separate hypothesis tests that make up a two-factor ANOVA, and explain the purpose of each test. Describe the mean differences that are evaluated by each of the three hypothesis test.The term "factor" in an experimental design is another name for the O independent variable dependent variable extraneous variables experimental design itself
- A medical researcher conducted an observational study to understand the recovery rate for patients infected with the COVID-19 in Malaysia. The researcher contacted thirteen COVID-19 survivors and interviewed them regarding their recovery experience. Two of the questions asked are the recovery period (in days) and the number of days that have passed since receiving the second dose of COVID-19 vaccine prior to infection. The recorded data is summarized as (at the image files). i) Identify the dependent variable in the study. ii) Calculate the correlation coefficient and interpret its value. iii) Estimate the regression model parameters and write the estimated linear regression model. iv) Based on your answer in iii), predict the recovery period if a person is infected with COVID-19 after 200 days of receiving second dose of COVID-19 vaccine. v) Table 1 represents the incomplete ANOVA table of the study. Find the values of P, Q, R and S. vi) Test the linearity between the two variables…Can you help asap, pleaseCan higher-order interactions be dropped to error in the analysis of fractional factorial designs? Why or why not ?
- Can someone please explain to me ASAP??!!An economist conducted a study of the possible association between weekly income and weekly grocery expenditures. The particular interest was whether higher income would result in shoppers spending more on groceries, A random sample of shoppers at a local supermarket was obtained, and a questionnaire was administered asking about the weekly income of the shopper's family and the grocery bill for that week. The gender of the shopper was also obtained. The graph below contains a scatterplot with a least-squares line.Consider the following population model for household consumption: cons = a + b1 * inc+ b2 * educ+ b3 * hhsize + u where cons is consumption, inc is income, educ is the education level of household head, hhsize is the size of a household. Suppose a researcher estimates the model and gets the predicted value, cons_hat, and then runs a regression of cons_hat on educ, inc, and hhsize. Which of the following choice is correct and please explain why. A) be certain that R^2 = 1 B) be certain that R^2 = 0 C) be certain that R^2 is less than 1 but greater than 0. D) not be certain
- A certain city divides naturally into ten district neighborhoods.How might a real estate appraiser select a sampleof single-family homes that could be used as a basis fordeveloping an equation to predict appraised value fromcharacteristics such as age, size, number of bathrooms,distance to the nearest school, and so on? Is the studyenumerative or analytic?Give me an example of a single factor design and an example of a factorial design. Provide the independent variable (IV) with its levels and dependent variable (DV) for the single factor design and the independent variables with their levels and DV for the factorial designExplain why it can be dangerous to use the least-squares line to obtain predictions for x values that are substantially larger or smaller than those contained in the sample. The least-squares line is based on the x values ---Select--- ✓the sample. We do not know that the same linear relationship will apply for x values ---Select--- the range of values in the sample. Therefore the least-squares line should not be used for x values ---Select--- the range of values in the sample.