How many trout were less than 20 inches long? Hint: 20 inches is the upper quartile of the box-and- whisker plot. So, 75% of the trout were less than 20 inches long. To find the answer: multiply the percentage (75%) x 20 (the number of inches) We use 75% because that is the Q3 in the data. 25% would be our Q1 and 50% is the median (or Q2).
How many trout were less than 20 inches long? Hint: 20 inches is the upper quartile of the box-and- whisker plot. So, 75% of the trout were less than 20 inches long. To find the answer: multiply the percentage (75%) x 20 (the number of inches) We use 75% because that is the Q3 in the data. 25% would be our Q1 and 50% is the median (or Q2).

MATLAB: An Introduction with Applications
6th Edition
ISBN:9781119256830
Author:Amos Gilat
Publisher:Amos Gilat
Chapter1: Starting With Matlab
Section: Chapter Questions
Problem 1P

Related questions
Question
![**Box-and-Whisker Plot Analysis of Trout Lengths**
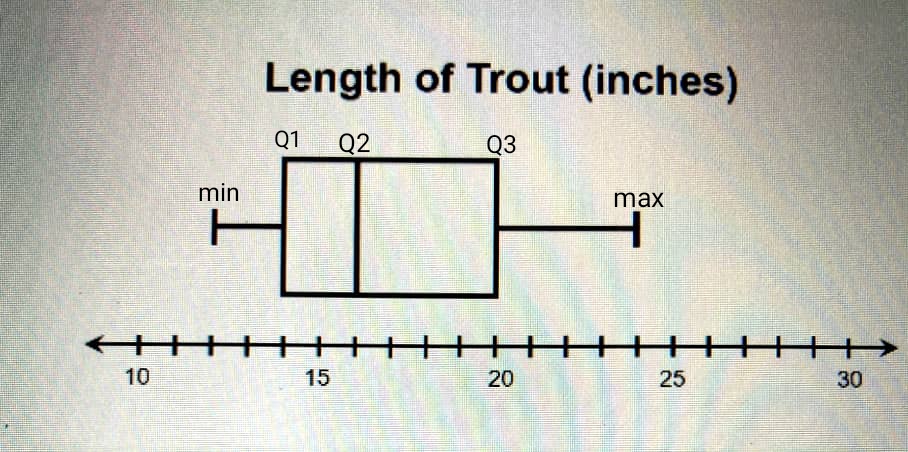
The box-and-whisker plot below represents the length, in inches, of 20 trout caught at Raystown Lake in one weekend.
**Length of Trout (inches)**
[Diagram Explanation]
- The box-and-whisker plot consists of a number line ranging from 10 to 30 inches.
- The box indicates the interquartile range, with the left edge at approximately 12 inches (the lower quartile, Q1) and the right edge at 20 inches (the upper quartile, Q3).
- The line inside the box marks the median (Q2) at around 15 inches.
- Whiskers extend from the box to the minimum at 10 inches and maximum at 28 inches.
**Question:**
How many trout were less than 20 inches long?
**Hint:**
20 inches is the upper quartile of the box-and-whisker plot. So, 75% of the trout were less than 20 inches long.
**Solution:**
To find the answer: multiply the percentage (75%) by 20 (the total number of trout). We use 75% because that is the Q3 in the data. 25% would be our Q1, and 50% is the median (Q2).](/v2/_next/image?url=https%3A%2F%2Fcontent.bartleby.com%2Fqna-images%2Fquestion%2F779c066b-94fa-4df6-b4e5-b5da5f34d1ed%2Fd735faab-d221-40f9-96d2-2412731a5ef3%2Fdhg0vif_processed.jpeg&w=3840&q=75)
Transcribed Image Text:**Box-and-Whisker Plot Analysis of Trout Lengths**
The box-and-whisker plot below represents the length, in inches, of 20 trout caught at Raystown Lake in one weekend.
**Length of Trout (inches)**
[Diagram Explanation]
- The box-and-whisker plot consists of a number line ranging from 10 to 30 inches.
- The box indicates the interquartile range, with the left edge at approximately 12 inches (the lower quartile, Q1) and the right edge at 20 inches (the upper quartile, Q3).
- The line inside the box marks the median (Q2) at around 15 inches.
- Whiskers extend from the box to the minimum at 10 inches and maximum at 28 inches.
**Question:**
How many trout were less than 20 inches long?
**Hint:**
20 inches is the upper quartile of the box-and-whisker plot. So, 75% of the trout were less than 20 inches long.
**Solution:**
To find the answer: multiply the percentage (75%) by 20 (the total number of trout). We use 75% because that is the Q3 in the data. 25% would be our Q1, and 50% is the median (Q2).

Transcribed Image Text:The image contains a multiple-choice format with the following options:
- **A**: 15
- **B**: 10
- **C**: 18
Below the options, there is a button labeled "Listen" with a play icon. At the bottom, there is an instruction that reads, "Continue on to the next page."
There are no graphs or diagrams present in the image.
Expert Solution
Step 1: We have given that

Step by step
Solved in 3 steps with 1 images

Recommended textbooks for you
MATLAB: An Introduction with Applications
Statistics
ISBN:
9781119256830
Author:
Amos Gilat
Publisher:
John Wiley & Sons Inc

Probability and Statistics for Engineering and th…
Statistics
ISBN:
9781305251809
Author:
Jay L. Devore
Publisher:
Cengage Learning

Statistics for The Behavioral Sciences (MindTap C…
Statistics
ISBN:
9781305504912
Author:
Frederick J Gravetter, Larry B. Wallnau
Publisher:
Cengage Learning
MATLAB: An Introduction with Applications
Statistics
ISBN:
9781119256830
Author:
Amos Gilat
Publisher:
John Wiley & Sons Inc
Probability and Statistics for Engineering and th…
Statistics
ISBN:
9781305251809
Author:
Jay L. Devore
Publisher:
Cengage Learning
Statistics for The Behavioral Sciences (MindTap C…
Statistics
ISBN:
9781305504912
Author:
Frederick J Gravetter, Larry B. Wallnau
Publisher:
Cengage Learning

Elementary Statistics: Picturing the World (7th E…
Statistics
ISBN:
9780134683416
Author:
Ron Larson, Betsy Farber
Publisher:
PEARSON

The Basic Practice of Statistics
Statistics
ISBN:
9781319042578
Author:
David S. Moore, William I. Notz, Michael A. Fligner
Publisher:
W. H. Freeman

Introduction to the Practice of Statistics
Statistics
ISBN:
9781319013387
Author:
David S. Moore, George P. McCabe, Bruce A. Craig
Publisher:
W. H. Freeman