How can I interpret or analyze the Pareto chart attached
Chapter1: An Overview Of Strategic Marketing
Section1.2: Dollar Shave Club: The Company For Men
Problem 2C
Related questions
Question
How can I interpret or analyze the Pareto chart attached

Transcribed Image Text:Paste your data here
Defects
Long Check-out process
Check-out & notifcation
Limited media options
poor customer assitance
Limited reading places
Limited printing option
Outdated Programs
Unfulfilled Request
Difficult Assets search
Total
n
Counts
1736
715
453
392
156
135
112
85
43
3827
9
↓Y
Calculations
Contribution (%)
45.36%
64.04%
75.88%
86.12%
90.20%
93.73%
96.66%
98.88%
100.00%

Transcribed Image Text:Count
2000
1800
1600
1400
1200
1000
800
600
400-
200
0+
Long Check-...
Check-out &...
Limited media...
poor customer...
Pareto Chart
Limited...
Limited...
Outdated...
Unfulfilled...
Difficult...
120.00%
100.00%
80.00%
60.00%
40.00%
20.00%
0.00%
Percent
Expert Solution
This question has been solved!
Explore an expertly crafted, step-by-step solution for a thorough understanding of key concepts.
This is a popular solution!
Trending now
This is a popular solution!
Step by step
Solved in 2 steps with 3 images

Follow-up Questions
Read through expert solutions to related follow-up questions below.
Follow-up Question
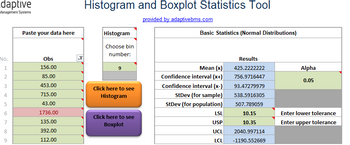
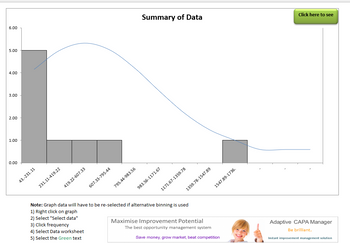
How do I analyze the histogram screenshots data attached below

Transcribed Image Text:daptive
Management Systems
No.
1234
5
6780
9
Paste your data here
Obs
156.00
85.00
453.00
715.00
43.00
1736.00
135.00
392.00
112.00
Histogram and Boxplot Statistics Tool
provided by adaptivebms.com
Histogram
Choose bin
number:
Click here to see
Histogram
Click here to see
Boxplot
Basic Statistics (Normal Distributions)
Mean (x)
Confidence interval (x+)
Confidence interval (x-)
StDev (for sample)
StDev (for population)
LSL
USP
UCL
LCL
Results
425.2222222
756.9716447
93.47279979
538.5916305
507.789059
10.15
10.35
2040.997114
-1190.552669
Alpha
0.05
Enter lower tolerance
Enter upper tolerance

Transcribed Image Text:6.00
5.00
4.00
3.00
2.00
1.00
"}}}}
0.00
43.-231.11
231.11-419.22
419.22-607.33
607.33-795.44
795.44-983.56
Summary of Data
983.56-1171.67
1171.67-1359.78
1359.78-1547.89
1547.89-1736.
Note: Graph data will have to be re-selected if alternative binning is used
1) Right click on graph
2) Select "Select data"
3) Click frequency
4) Select Data worksheet
5) Select the Green text
Maximise Improvement Potential
The best opportunity management system
Save money, grow market, beat competition
Click here to see
Adaptive CAPA Manager
Be brilliant.
Instant improvement management solution
Solution
Follow-up Question
By looking at the Pareto chart, which issue is the highest priority and where will be appropriate to focus.
Solution
Recommended textbooks for you


Foundations of Business (MindTap Course List)
Marketing
ISBN:
9781337386920
Author:
William M. Pride, Robert J. Hughes, Jack R. Kapoor
Publisher:
Cengage Learning

Foundations of Business - Standalone book (MindTa…
Marketing
ISBN:
9781285193946
Author:
William M. Pride, Robert J. Hughes, Jack R. Kapoor
Publisher:
Cengage Learning


Foundations of Business (MindTap Course List)
Marketing
ISBN:
9781337386920
Author:
William M. Pride, Robert J. Hughes, Jack R. Kapoor
Publisher:
Cengage Learning

Foundations of Business - Standalone book (MindTa…
Marketing
ISBN:
9781285193946
Author:
William M. Pride, Robert J. Hughes, Jack R. Kapoor
Publisher:
Cengage Learning