Hours worked per week 21 10 20 17 13 13 20 15 17 19 20 13 13 14 14 What proportion of scores fall above the lowest score for hours worked? What proportion of scores fall between the highest score and the median score for hours worked?


Inverse Normal Distribution
The method used for finding the corresponding z-critical value in a normal distribution using the known probability is said to be an inverse normal distribution. The inverse normal distribution is a continuous probability distribution with a family of two parameters.
Mean, Median, Mode
It is a descriptive summary of a data set. It can be defined by using some of the measures. The central tendencies do not provide information regarding individual data from the dataset. However, they give a summary of the data set. The central tendency or measure of central tendency is a central or typical value for a probability distribution.
Z-Scores
A z-score is a unit of measurement used in statistics to describe the position of a raw score in terms of its distance from the mean, measured with reference to standard deviation from the mean. Z-scores are useful in statistics because they allow comparison between two scores that belong to different normal distributions.
|
Hours worked per week |
|
21 |
|
10 |
|
20 |
|
17 |
|
13 |
|
13 |
|
20 |
|
15 |
|
17 |
|
19 |
|
20 |
|
13 |
|
13 |
|
14 |
|
14 |
- What proportion of scores fall above the lowest score for hours worked?
- What proportion of scores fall between the highest score and the
median score for hours worked?
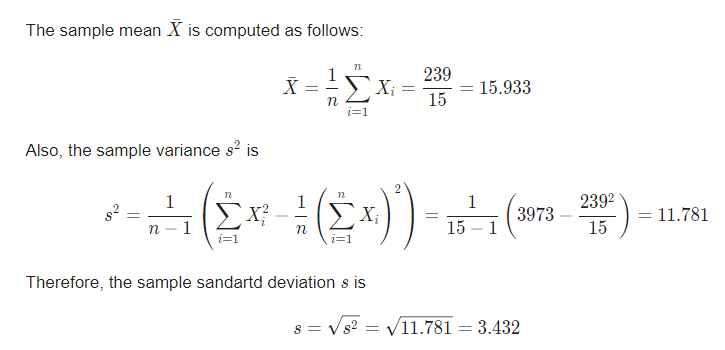
Data represents Hours worked per week .
First find mean & standard deviation for the given data .
The sample size is . The provided sample data along with the data required to compute the sample mean and sample variance are shown in the table below:
| X | X2 | |
| 21 | 441 | |
| 10 | 100 | |
| 20 | 400 | |
| 17 | 289 | |
| 13 | 169 | |
| 13 | 169 | |
| 20 | 400 | |
| 15 | 225 | |
| 17 | 289 | |
| 19 | 361 | |
| 20 | 400 | |
| 13 | 169 | |
| 13 | 169 | |
| 14 | 196 | |
| 14 | 196 | |
| Sum = | 239 | 3973 |

Step by step
Solved in 2 steps with 3 images


