Homework Part 2 of 3 Points: 0.67 of 1 A frequency distribution is shown below. Complete parts (a) and (b). The number of televisions per household in a small town Televisions 1 2 3 Households 23 441 730 1405 .... (a) Use the frequency distribution to construct a probability distribution. P(x) 0.009 1 0.170 2 0.281 3 0.541 (Round to three decimal places as needed.) (b) Graph the probability distribution using a histogram. Choose the correct graph of the distribution below. O A. O B. OC. AP(x) 0.6- 0.5- 0.4- 0.3- 0.2- AP(x) 0.6- 0.5- 0.4- 0.3- 0.2- AP(x) 0.6- 0.5 0.4- 0.3- 0.2- 0.1- 0.1- 0.1- 6123x # of Televisions #of Televisions # of Televisions
Homework Part 2 of 3 Points: 0.67 of 1 A frequency distribution is shown below. Complete parts (a) and (b). The number of televisions per household in a small town Televisions 1 2 3 Households 23 441 730 1405 .... (a) Use the frequency distribution to construct a probability distribution. P(x) 0.009 1 0.170 2 0.281 3 0.541 (Round to three decimal places as needed.) (b) Graph the probability distribution using a histogram. Choose the correct graph of the distribution below. O A. O B. OC. AP(x) 0.6- 0.5- 0.4- 0.3- 0.2- AP(x) 0.6- 0.5- 0.4- 0.3- 0.2- AP(x) 0.6- 0.5 0.4- 0.3- 0.2- 0.1- 0.1- 0.1- 6123x # of Televisions #of Televisions # of Televisions

MATLAB: An Introduction with Applications
6th Edition
ISBN:9781119256830
Author:Amos Gilat
Publisher:Amos Gilat
Chapter1: Starting With Matlab
Section: Chapter Questions
Problem 1P

Related questions
Question
It’s three part

Transcribed Image Text:points
O Points: 0.67 of 1
Homework
Part 2 of 3
A frequency distribution is shown below. Complete parts (a) and (b).
The number of televisions per household in a small town
Televisions
1
Households
23
441
730
1405
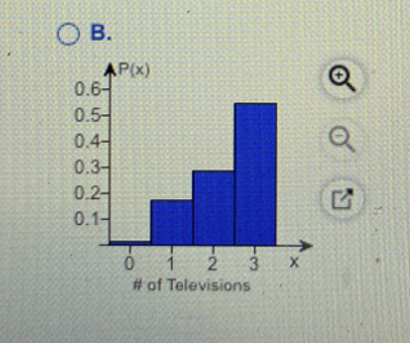
(a) Use the frequency distribution to construct a probability distribution.
P(x)
0.009
0.170
0.281
3
0.541
(Round to three decimal places as needed.)
(b) Graph the probability distribution using a histogram. Choose the correct graph of the distribution below.
O A.
OB.
OC.
AP(x)
0.6-
0.5-
0.4-
AP(x)
0.6-
0.5-
0.4-
0.3-
0.2-
0.1-
AP(x)
0.6-
0.5-
0.4-
0.3-
0.2-
0.1-
0.3-
0.2-
0.1-
012 3
# of Televisions
# of Televisions
# of Televisions
Help me solve this
View an example
Get more help -
Clear all
Expert Solution
Step 1
(b) Correct graph of the distribution is

Trending now
This is a popular solution!

Step by step
Solved in 2 steps with 1 images

Recommended textbooks for you
MATLAB: An Introduction with Applications
Statistics
ISBN:
9781119256830
Author:
Amos Gilat
Publisher:
John Wiley & Sons Inc

Probability and Statistics for Engineering and th…
Statistics
ISBN:
9781305251809
Author:
Jay L. Devore
Publisher:
Cengage Learning

Statistics for The Behavioral Sciences (MindTap C…
Statistics
ISBN:
9781305504912
Author:
Frederick J Gravetter, Larry B. Wallnau
Publisher:
Cengage Learning
MATLAB: An Introduction with Applications
Statistics
ISBN:
9781119256830
Author:
Amos Gilat
Publisher:
John Wiley & Sons Inc
Probability and Statistics for Engineering and th…
Statistics
ISBN:
9781305251809
Author:
Jay L. Devore
Publisher:
Cengage Learning
Statistics for The Behavioral Sciences (MindTap C…
Statistics
ISBN:
9781305504912
Author:
Frederick J Gravetter, Larry B. Wallnau
Publisher:
Cengage Learning

Elementary Statistics: Picturing the World (7th E…
Statistics
ISBN:
9780134683416
Author:
Ron Larson, Betsy Farber
Publisher:
PEARSON

The Basic Practice of Statistics
Statistics
ISBN:
9781319042578
Author:
David S. Moore, William I. Notz, Michael A. Fligner
Publisher:
W. H. Freeman

Introduction to the Practice of Statistics
Statistics
ISBN:
9781319013387
Author:
David S. Moore, George P. McCabe, Bruce A. Craig
Publisher:
W. H. Freeman