Home Insert Page Layout Formulas Data Review View Key West Phoenix Carmel Total 2 Revenues 3 Variable costs 4 Fixed costs 5 Operating income 6 Interest costs on long-term debt at 8% 7 Income before taxes 8 Net income after 35% taxes $4,100,000 1,600,000 1,280,000 1,220,000 368,000 852,000 $4,380,000 1,630,000 1,560,000 $3,230,000 955,000 980,000 $11,710,000 4,185,000 3,820,000 3,705,000 1,224,000 2,481,000 1,190,000 416,000 1,295,000 440,000 855,000 774,000 553,800 503,100 555,750 1,612,650 10 Net book value at 2017 year-end: 11 Current assets 12 Long-tem assets 13 Total assets $ 850,000 5,462,000 6,312,000 $ 2,730,000 17,172,000 19,902,000 $1,280,000 4,875,000 6,155,000 $ 600,000 6,835,000 7,435,000 14 15 Current liabilities 16 Long-term debt 17 Stockholders' equity 18 Total liabilities and stockholders' equity 330,000 4,600,000 1,225,000 6,155,000 265,000 5,200,000 847,000 84,000 5,500,000 1,851,000 7,435,000 679,000 15,300,000 3,923,000 19,902,000 6,312,000 19 20 Market value of debt 21 Market value of equity 22 Cost of equity capital 23 Required rate of return 24 Accumulated depreciation on long-temm assets $15,300,000 7,650,000 14% 11% $2,200,000 $1,510,000 $ 220,000


. Refresh Resorts, Inc., operates health spas in Key West, Florida; Phoenix, Arizona; and Carmel, California. The Key West spa was the company’s first and opened in 1991. The Phoenix spa opened in 2004, and the Carmel spa opened in 2013. Refresh Resorts has previously evaluated divisions based on RI, but the company is considering changing to an EVA approach. All spas are assumed to face similar risks. Data for 2017 are:
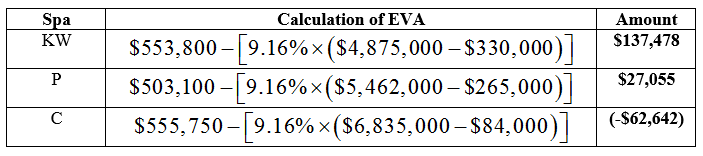
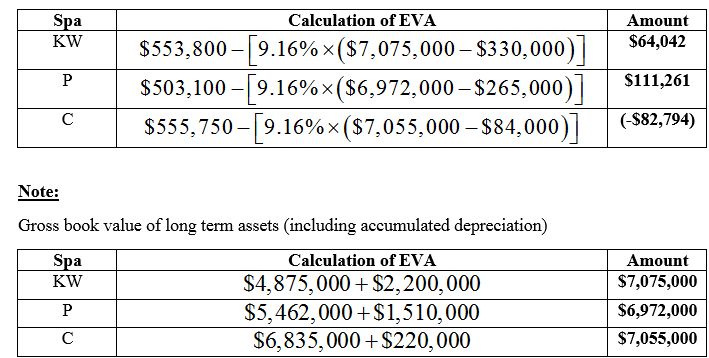
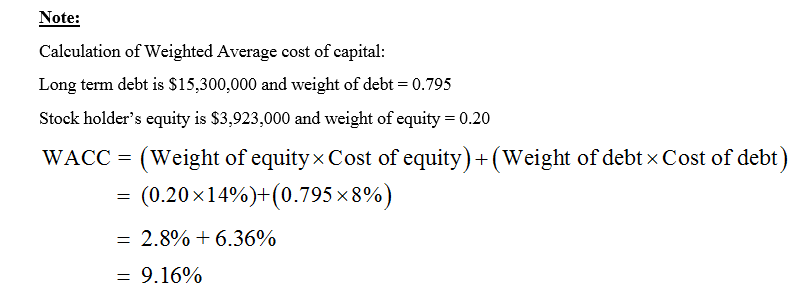
Q.Refer back to the original data. Calculate EVA for each of the spas, using net book value of long-term assets. Calculate EVA again, this time using gross book value of long-term assets. Comment on the differences between the two methods.

Following are the computation of EVA for each spa using net book value of long term assets:
Following are the computation of EVA for each spa using gross book value of long term assets:

Step by step
Solved in 3 steps with 3 images


