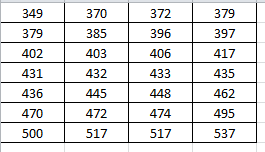
Here is a data set: 349 379 402 431 436 470 500 370 372 385 396 403 406 432 433 445 448 472 474 517 517 379 397 417 435 462 495 537 Construct a frequency distribution table for this data set. Number of classes: 10 • Use a "nice" class width, such as a multiple of 5 or 10. Label classes using interval notation. o For example, if the class is 70-79, label it as [70,79]. • The lower class limit should be a multiple of the class width. o For example, if the class width is 10, the lower class limit should be a number like 30 or 40 (depending on the data).
Here is a data set: 349 379 402 431 436 470 500 370 372 385 396 403 406 432 433 445 448 472 474 517 517 379 397 417 435 462 495 537 Construct a frequency distribution table for this data set. Number of classes: 10 • Use a "nice" class width, such as a multiple of 5 or 10. Label classes using interval notation. o For example, if the class is 70-79, label it as [70,79]. • The lower class limit should be a multiple of the class width. o For example, if the class width is 10, the lower class limit should be a number like 30 or 40 (depending on the data).
MATLAB: An Introduction with Applications
6th Edition
ISBN:9781119256830
Author:Amos Gilat
Publisher:Amos Gilat
Chapter1: Starting With Matlab
Section: Chapter Questions
Problem 1P
Related questions
Question
Help
![Here is a data set:
#
Construct a frequency distribution table for this data set.
• Number of classes: 10
Use a "nice" class width, such as a multiple of 5 or 10.
• Label classes using interval notation.
o For example, if the class is 70-79, label it as [70,79].
• The lower class limit should be a multiple of the class width.
M
E
D
$
o For example, if the class width is 10, the lower class limit should be a number like 30 or 40
(depending on the data).
101
R
F
ts
%
5
349
370 372 379
379
385
396 397
402 403
406 417
431
432
433
435
436
445
448
462
470
472
474
495
500
517 517
537
T
1640
G
H
6
Q Search
&
Y
fe
4+
*
U
H +||
00
J
► 11
K
O
L](/v2/_next/image?url=https%3A%2F%2Fcontent.bartleby.com%2Fqna-images%2Fquestion%2F6fcf9c34-9d25-4429-b2c5-bfe59b993d67%2F3cab1ebc-ee8c-4cef-be47-468d334cd458%2Fwmlu3nzo_processed.jpeg&w=3840&q=75)
Transcribed Image Text:Here is a data set:
#
Construct a frequency distribution table for this data set.
• Number of classes: 10
Use a "nice" class width, such as a multiple of 5 or 10.
• Label classes using interval notation.
o For example, if the class is 70-79, label it as [70,79].
• The lower class limit should be a multiple of the class width.
M
E
D
$
o For example, if the class width is 10, the lower class limit should be a number like 30 or 40
(depending on the data).
101
R
F
ts
%
5
349
370 372 379
379
385
396 397
402 403
406 417
431
432
433
435
436
445
448
462
470
472
474
495
500
517 517
537
T
1640
G
H
6
Q Search
&
Y
fe
4+
*
U
H +||
00
J
► 11
K
O
L
Expert Solution
Step 1
The question is about frequency distribution
Given :

To find :
To construct freq. distribution table
Trending now
This is a popular solution!
Step by step
Solved in 2 steps with 2 images

Recommended textbooks for you

MATLAB: An Introduction with Applications
Statistics
ISBN:
9781119256830
Author:
Amos Gilat
Publisher:
John Wiley & Sons Inc

Probability and Statistics for Engineering and th…
Statistics
ISBN:
9781305251809
Author:
Jay L. Devore
Publisher:
Cengage Learning

Statistics for The Behavioral Sciences (MindTap C…
Statistics
ISBN:
9781305504912
Author:
Frederick J Gravetter, Larry B. Wallnau
Publisher:
Cengage Learning

MATLAB: An Introduction with Applications
Statistics
ISBN:
9781119256830
Author:
Amos Gilat
Publisher:
John Wiley & Sons Inc

Probability and Statistics for Engineering and th…
Statistics
ISBN:
9781305251809
Author:
Jay L. Devore
Publisher:
Cengage Learning

Statistics for The Behavioral Sciences (MindTap C…
Statistics
ISBN:
9781305504912
Author:
Frederick J Gravetter, Larry B. Wallnau
Publisher:
Cengage Learning

Elementary Statistics: Picturing the World (7th E…
Statistics
ISBN:
9780134683416
Author:
Ron Larson, Betsy Farber
Publisher:
PEARSON

The Basic Practice of Statistics
Statistics
ISBN:
9781319042578
Author:
David S. Moore, William I. Notz, Michael A. Fligner
Publisher:
W. H. Freeman

Introduction to the Practice of Statistics
Statistics
ISBN:
9781319013387
Author:
David S. Moore, George P. McCabe, Bruce A. Craig
Publisher:
W. H. Freeman