Hello, I have a problem to solve in my macroeconomics class, I am so lost to begin with, and I would like help •Using the Supply and Demand Model •Starting from a point of equilibrium demonstrate and explain the effect on Price and Quantity Use the 5 step process from class •A. Government wishes to create a minimum wage by creating a minimum wage of $10.00 when the market for unskilled labor is $5.00 •B. Government wants to solve affordable housing by making the maximum rent $2,000 for an apartment in NYC, when the market rent is $3,500 •Has the principle of the government can sometimes make the market better off been realized with these two policies? •How can the Government increase market wages and decrease market rents without harm to the market?


Hello, I have a problem to solve in my
Hey, Thank you for the question. According to our policy we can only answer upto 3 subparts per session. If you need further help, post the question again and mention the number that you want us to solve.
Starting from a point of equilibrium, the effect on Price and Quantity using the 5-step process:
Step 1- Draw the demand and supply curves with the following information:
- The law of demand- When the price increases and all other things are constant, quantity demanded reduces and vice versa. This tells us the slope of demand curve.
- The law of supply- When the price increases and all other things are constant, quantity supplied increases and vice versa. This tells us the slope of supply curve.
- Variables responsible for the shift in demand and supply curve from which initial equilibrium is found out.
Step 2- Check whether economic changes affect the demand or supply.
Step 3- If the analysed economic changes leads to a shift in demand or supply curves which would lead to a change in the quantity demanded or supplied
Step 4- Set the new equilibrium after the shift of demand or supply curves.
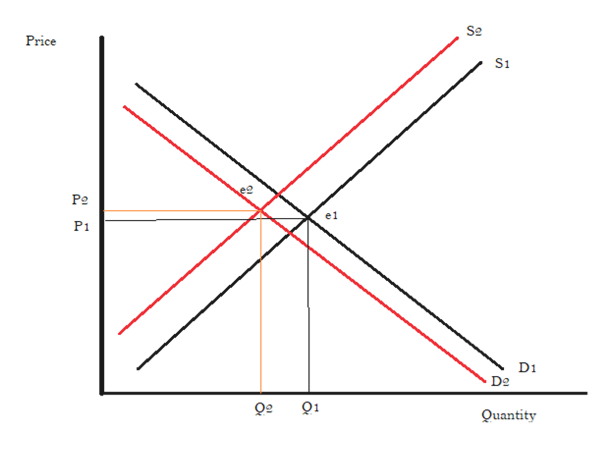
Step 5- Compare the new equilibrium price (P1) and quantity (Q1) with the initial equilibrium price (P2) and quantity (Q2).
These 5 points can be analysed in the graph given below:

Trending now
This is a popular solution!

Step by step
Solved in 4 steps with 3 images


