he number of cases within 3 days due to coronavirus is as follows: 21 May 2020: 961 New Case 22 May 2020: 952 New Case
Contingency Table
A contingency table can be defined as the visual representation of the relationship between two or more categorical variables that can be evaluated and registered. It is a categorical version of the scatterplot, which is used to investigate the linear relationship between two variables. A contingency table is indeed a type of frequency distribution table that displays two variables at the same time.
Binomial Distribution
Binomial is an algebraic expression of the sum or the difference of two terms. Before knowing about binomial distribution, we must know about the binomial theorem.
The number of cases within 3 days due to coronavirus is as follows:
21 May 2020: 961 New Case
22 May 2020: 952 New Case
23 May 2020: 1186 New Case
1a) Calculate the growth rate according to this information and express this variable as X = Aert.
2a) Using the answer 1a, Make a prediction for the previous and next day of the end date you use in your calculations.
(1a)
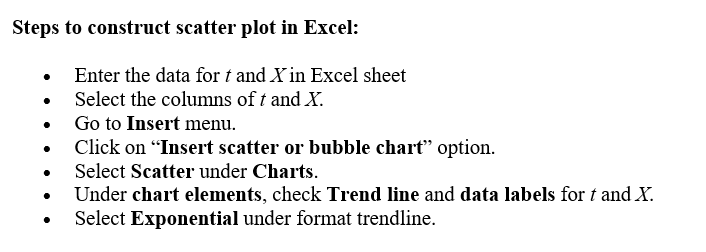
Let us consider the time values t as 1, 2, and so on.
X: as the number of new cases.

Step by step
Solved in 2 steps with 2 images


