-> A elearning.kctcs.edu/ultra/courses/ 493574360 1/cl/outline Question 13 32 28 16 12 a T TTT 4 8. 12 16 20 24 28 32 t (seconds) The figure above is the position vs, time graph for an object. What is the object's velocity (in m/s) during segment 'a' of the graph? Selected Answer: 2.25 Question 14 A Using the same position vs. time graph above, what is the object's velocity (in m/s) during segment 'b? Selected Answer: 1.71 Question 15 Using the same position vs, time graph above. what is the object's velocity (in m/s) during segment 'c? Selected Answer: 66 Tuesday, October 20, 2020 9:27:38 PM EDT O Labo1 intro (1)docx O Lab01 Intro.docx O Homework 0.pdf Student Orientati.html (saau) p
-> A elearning.kctcs.edu/ultra/courses/ 493574360 1/cl/outline Question 13 32 28 16 12 a T TTT 4 8. 12 16 20 24 28 32 t (seconds) The figure above is the position vs, time graph for an object. What is the object's velocity (in m/s) during segment 'a' of the graph? Selected Answer: 2.25 Question 14 A Using the same position vs. time graph above, what is the object's velocity (in m/s) during segment 'b? Selected Answer: 1.71 Question 15 Using the same position vs, time graph above. what is the object's velocity (in m/s) during segment 'c? Selected Answer: 66 Tuesday, October 20, 2020 9:27:38 PM EDT O Labo1 intro (1)docx O Lab01 Intro.docx O Homework 0.pdf Student Orientati.html (saau) p
Related questions
Question
100%
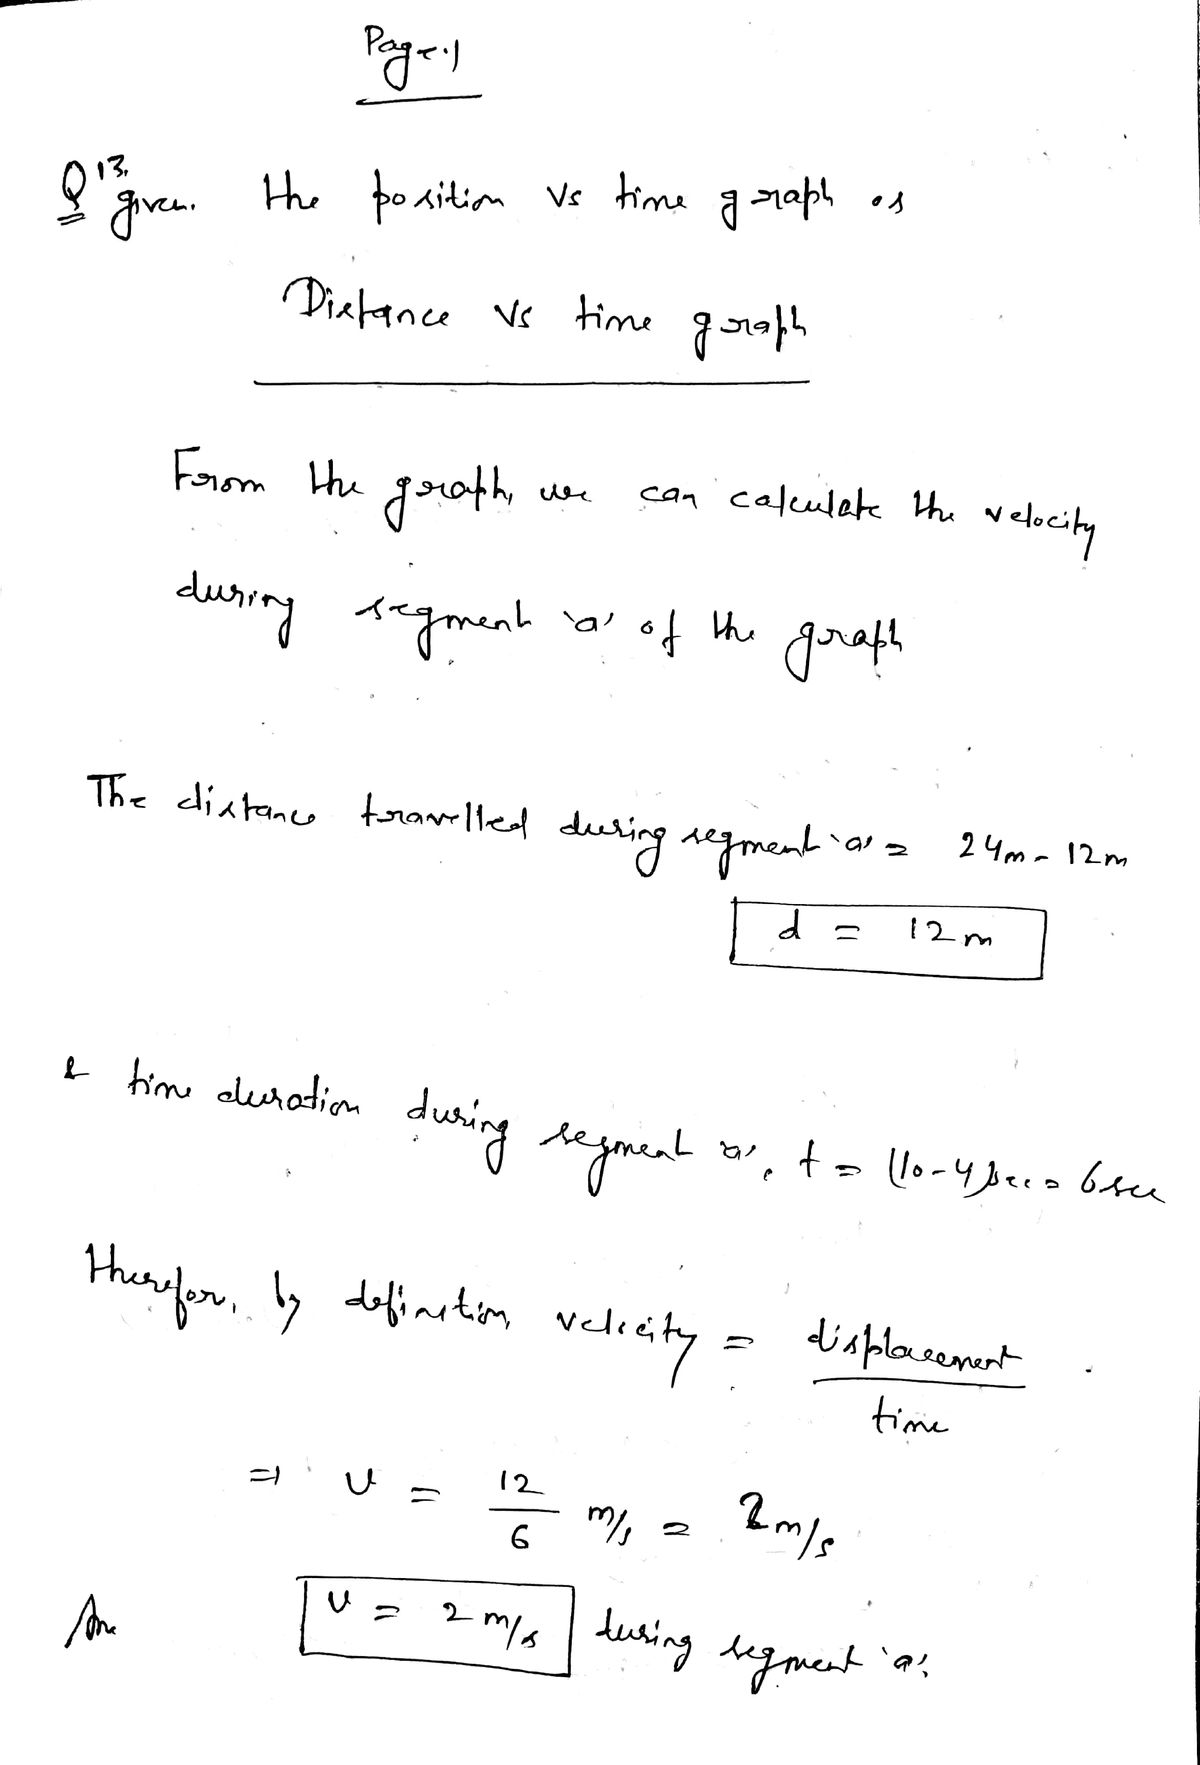
Please help I cannot get these right

Transcribed Image Text:**Position vs. Time Graph Analysis**
**Graph Explanation:**
The graph displayed is a position vs. time graph for an object. It shows the position \(d\) in meters on the y-axis and time \(t\) in seconds on the x-axis. The graph is divided into segments labeled a, b, and c. Each segment represents a different type of motion:
- **Segment a**: The graph shows a rising line indicating an increasing position over time.
- **Segment b**: The graph displays a horizontal line, which indicates constant position and therefore no motion.
- **Segment c**: The graph shows a declining line indicating a decreasing position over time.
**Question 13:**
"What is the object's velocity (in m/s) during segment 'a'?"
- **Selected Answer**: -2.25 m/s
**Question 14:**
"Using the same position vs. time graph above, what is the object's velocity (in m/s) during segment 'b'?"
- **Selected Answer**: 1.71 m/s
**Question 15:**
"Using the same position vs. time graph, what is the object's velocity (in m/s) during segment 'c'?"
- **Selected Answer**: 0.66 m/s
These questions assess understanding of velocity as it relates to the slope of the segments within the graph. Positive slopes indicate forward motion, negative slopes indicate backward motion, and horizontal lines indicate no motion.
Expert Solution
Step 1

Step by step
Solved in 2 steps with 2 images
