Elementary Geometry For College Students, 7e
7th Edition
ISBN:9781337614085
Author:Alexander, Daniel C.; Koeberlein, Geralyn M.
Publisher:Alexander, Daniel C.; Koeberlein, Geralyn M.
ChapterP: Preliminary Concepts
SectionP.CT: Test
Problem 1CT
Related questions
Question

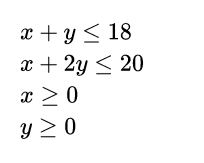
Transcribed Image Text:### Graphing Linear Inequalities
In this exercise, you are given a set of inequalities to graph:
1. \( x + y \leq 18 \)
2. \( x + 2y \leq 20 \)
3. \( x \geq 0 \)
4. \( y \geq 0 \)
**Hint:** There are 4 inequalities to graph.
### Graph Details
The graph is a coordinate grid. The y-axis values range from 21 to 25, labeled sequentially. Use this grid to plot the inequalities and shade the feasible region that satisfies all the inequalities.
### Steps to Graph:
1. **Boundary Lines:**
- Draw lines for each inequality. Use solid lines for \(\leq\) or \(\geq\).
- For \(x + y = 18\), plot the line where the sum of \(x\) and \(y\) is 18.
- For \(x + 2y = 20\), plot the line where \(x\) plus twice \(y\) equals 20.
- The lines \(x = 0\) and \(y = 0\) are the x-axis and y-axis respectively.
2. **Shading:**
- Determine which side of each line satisfies the inequality.
- The region where all shaded areas overlap is the solution set.
This graph represents the set of points that satisfy all the inequalities simultaneously.
Expert Solution
Step 1

Step by step
Solved in 4 steps with 4 images

Recommended textbooks for you

Elementary Geometry For College Students, 7e
Geometry
ISBN:
9781337614085
Author:
Alexander, Daniel C.; Koeberlein, Geralyn M.
Publisher:
Cengage,

Elementary Geometry for College Students
Geometry
ISBN:
9781285195698
Author:
Daniel C. Alexander, Geralyn M. Koeberlein
Publisher:
Cengage Learning

Elementary Geometry For College Students, 7e
Geometry
ISBN:
9781337614085
Author:
Alexander, Daniel C.; Koeberlein, Geralyn M.
Publisher:
Cengage,

Elementary Geometry for College Students
Geometry
ISBN:
9781285195698
Author:
Daniel C. Alexander, Geralyn M. Koeberlein
Publisher:
Cengage Learning